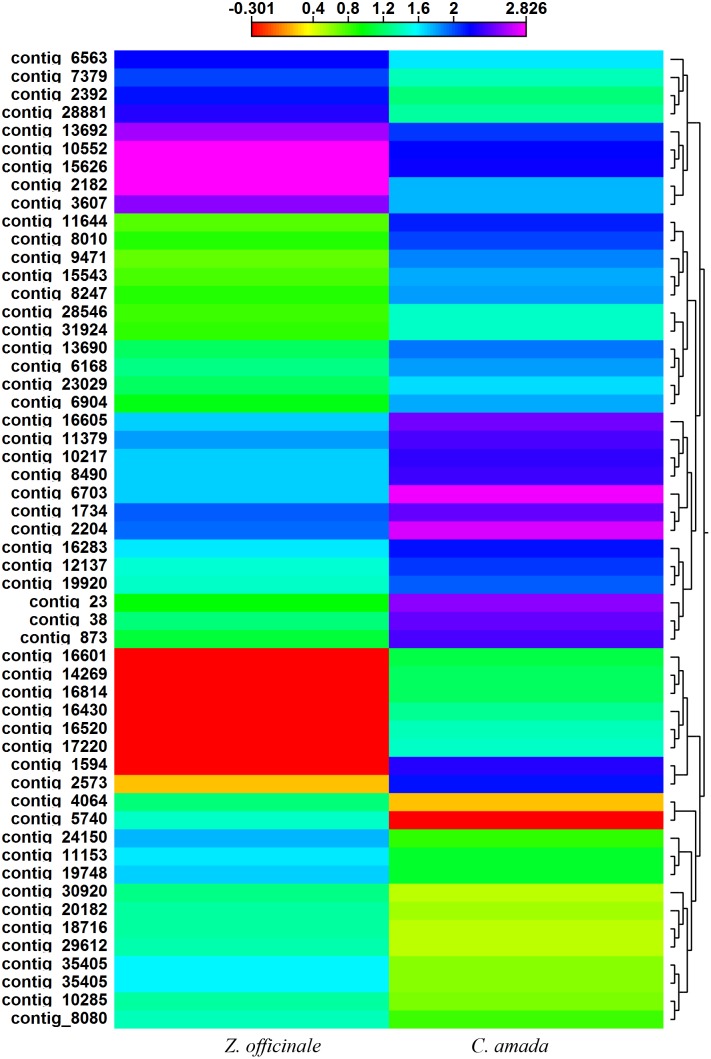
Figure 7. Divergence in the expression levels of transcription factors (TF) transcripts between C. amada and Z. officinale.
Heat map and clustering analysis of the transcripts of genes encoding TFs are shown. Higher expression of TFs occurs in C. amada. The high expression levels are depicted in purple and low expression in red. Clustering and heat map was drawn with CLC Genomics Workbench based on an Euclidean distance matrix, after normalization of expression values.

