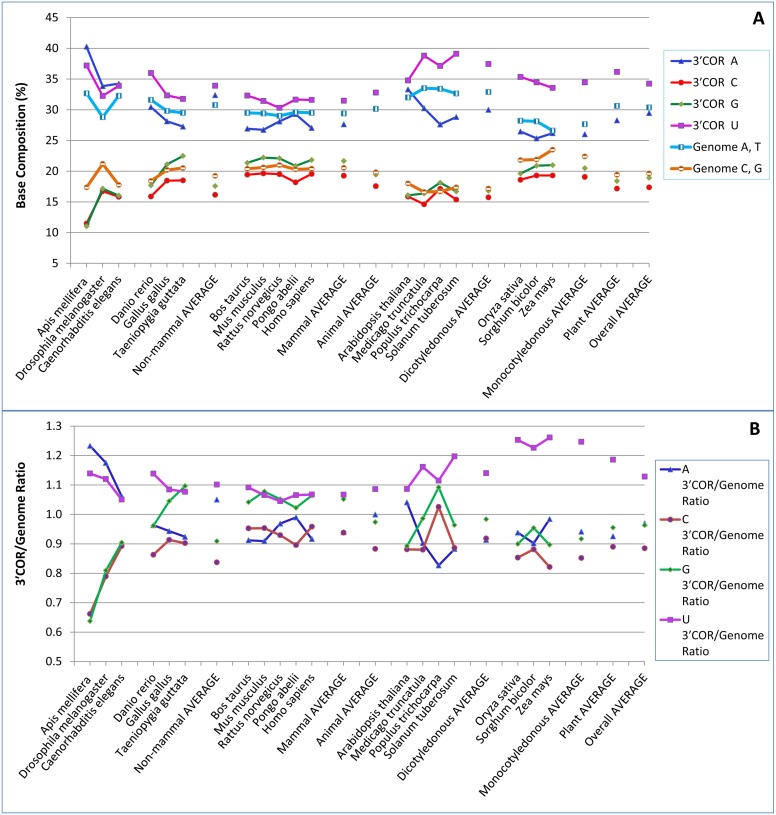
Figure 1. RNA base compositions of the three-prime cleaved-off region (3′COR), represented by the 100 bases downstream of the polyadenylation [poly(A)] site.
(A) Base compositions of the 3′COR and the whole genome of each species. (B) 3′COR/genome ratios for base composition. The mapping used NCBI mRNA sequences. The mapped extra copies were eliminated if the sequences in the 100-base three-prime untranslated region were identical. Note that for the 3′COR, U was richest in all species except Apis mellifera and Drosophila melanogaster, two insect invertebrates, in which A was richest. In Caenorhabditis elegans (a nematode), the A, C, G and U contents in the 3′COR are 34.3%, 15.8%, 16.0%, and 33.9%, respectively. Monocotyledonous plants had lower U contents but higher 3′COR/genome ratios in the 3′COR than did dicotyledonous plants.

