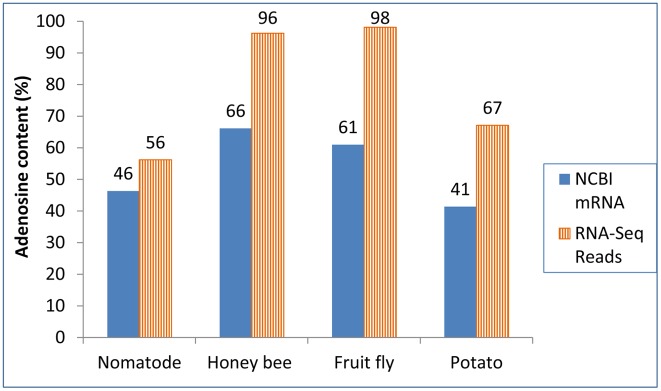
Figure 5. Adenosine content (i.e., A content) for the first six bases of 3′COR.

This 6 bases include the poly(A) site and the 5 immediately downstream bases. The A content represents the average percentage of A in the 6-base region of all mapped poly(A) sites. The RNA-Seq reads were from TruSeq using Illumina HiSeq 2000 or 2500. Information about the Sequence Read Achives (SRA) transcriptomic files can be found in Table 5. NCBI mRNA and RNA-Seq reads were significantly different in this 6-base region according the Excel “ChiTest” in each of these four species (P<0.0001). Note that this six-base region showed higher adenosine content in mapping with RNA-Seq reads than mapping with NCBI mRNA.
