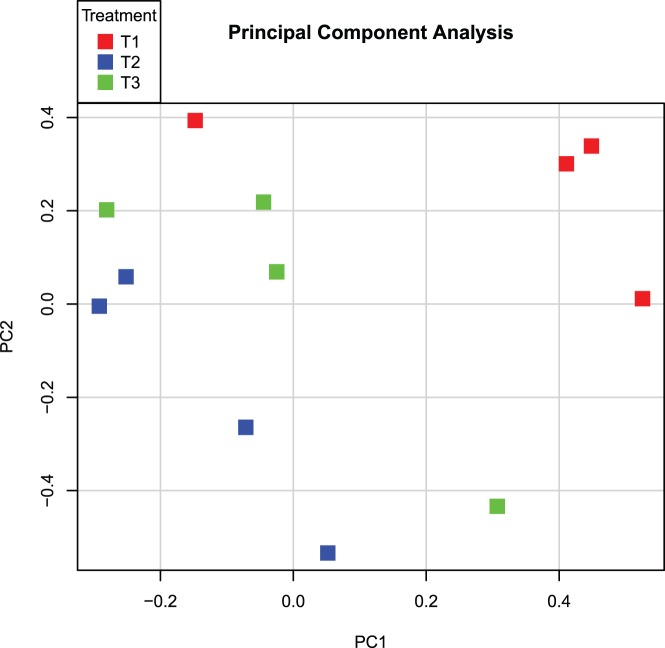
Figure 4. Principal component analysis of blood transcriptomes.
A principal component analysis was performed on the 12 blood transcriptome data sets which remained after quality control. Treatment 1 (T1) is depicted in red, T2 in blue, and T3 in green. The x-axis depicts principal component 1, whereas the y-axis depicts principal component 2.

