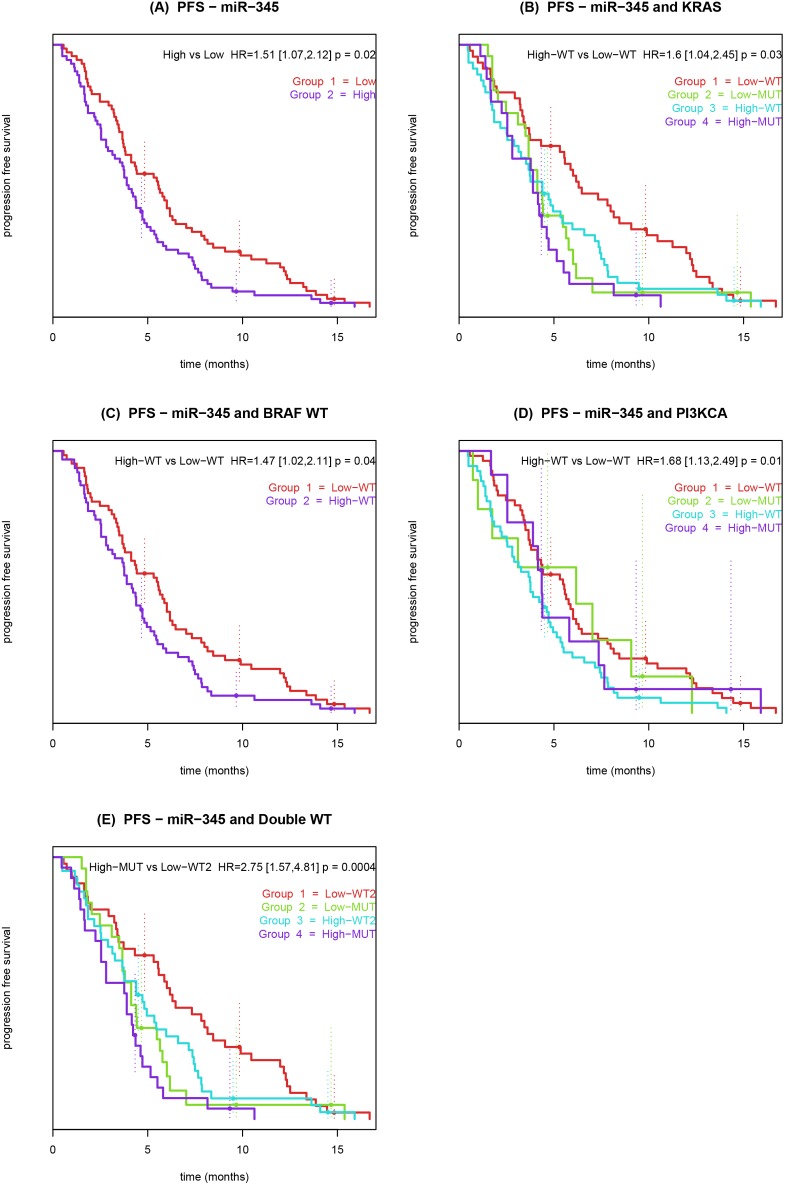
Figure 3. Kaplan-Meier curves showing the association between progression free survival, pre-treatment miR-345 expression in whole blood and mutational status of patients with metastatic colorectal cancer treated with 3rd line cetuximab and irinotecan.
Patients were dichotomized by low miR-345 expression (red) and high miR-345 expression (blue). (A) Patients were dichotomized by the median expression value for miR-345. (B) Patients were dichotomized by KRAS mutations status and miR-345. (C) Patients were dichotomized by BRAF WT mutations status and miR-345. (D) Patients were dichotomized by PI3KCA mutations status and miR-345. (E) Patients were dichotomized by double wt mutation status and miR-345. The P-value refers to the Wald test.

