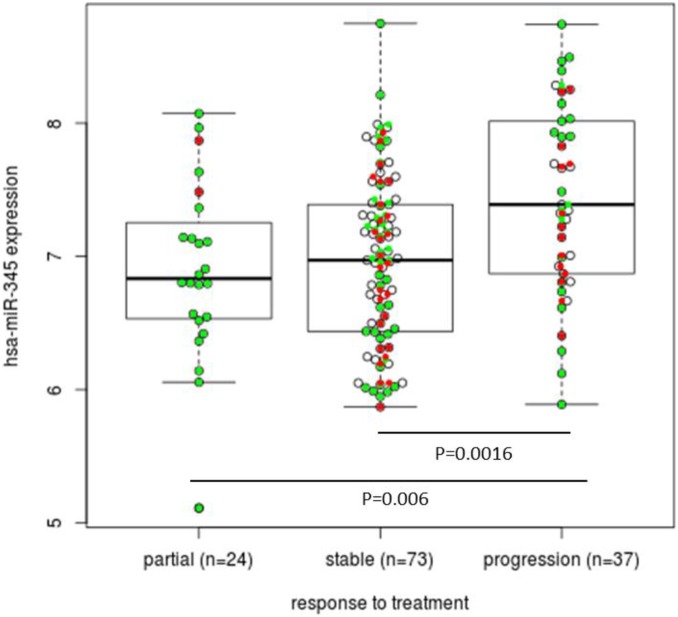
Figure 4. Box plot showing the association between miR-345 expression and response to treatment (partial response, stable disease and progression). Mann-Whitney test; KRAS wt patients (green dots), KRAS mutated patients (red dots).
If we restrict our set of patients to those with partial response (n = 24) and progressive disease (n = 37), a significant relationship between miR-345 expression and response to therapy was obtained with an odds ratio of 5.37, (P-value = 0.004 and 95% CI: 1.56–20.94).

