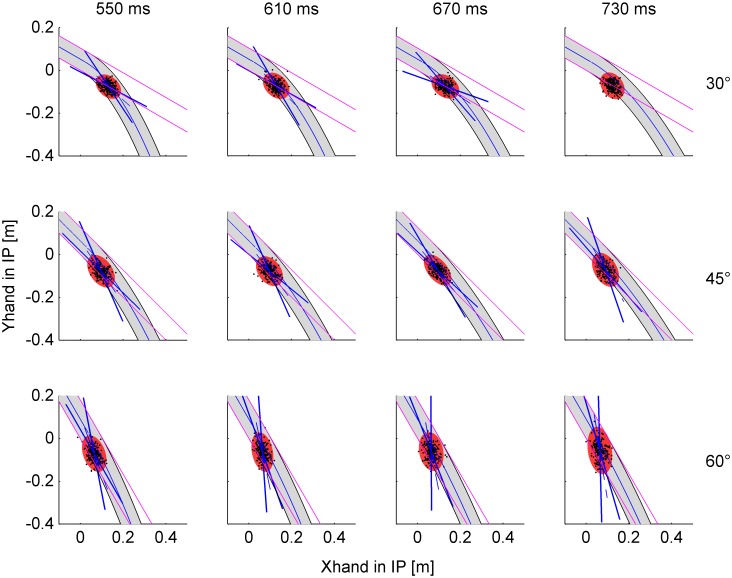
Figure 5. Experiment 1.
Spatial distribution of interception points. IPs in single trials (black dots) and 95%-tolerance ellipses (red) for each condition. The first eigenvector (along the major axis of the ellipse) with the 95%-confidence cone (blue straight lines) is drawn when significant (see text). The gray area within black curved lines represents the envelope of the ball trajectory, and the blue curved line is the trajectory of the ball center. The pink straight lines represent the linear trajectory that would be followed by the ball if it continued the motion on the extended inclined plane.

