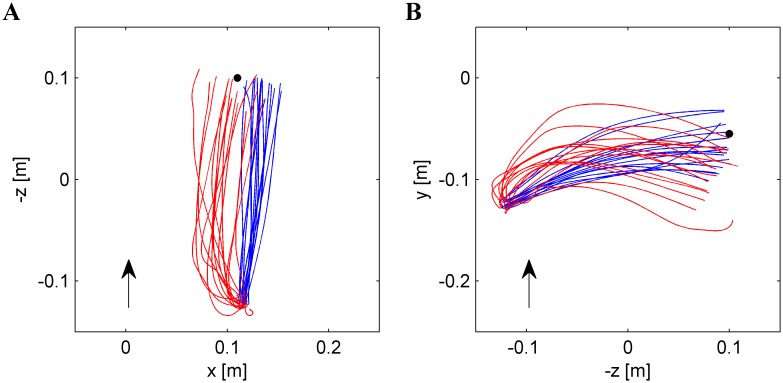
Figure 8. Paths of hand movement in a representative subject who performed both Experiment 1 (red) and Experiment 2 (blue).
All repetitions (n = 15, tilt angle = 45°, nBMD = 610 ms) are plotted from the starting position to IP. Black dot represents nIP. 2D projections from above and from right side are plotted in A and B panels, respectively. Arrows indicate forward direction and upward direction of the movement in A and B, respectively.

