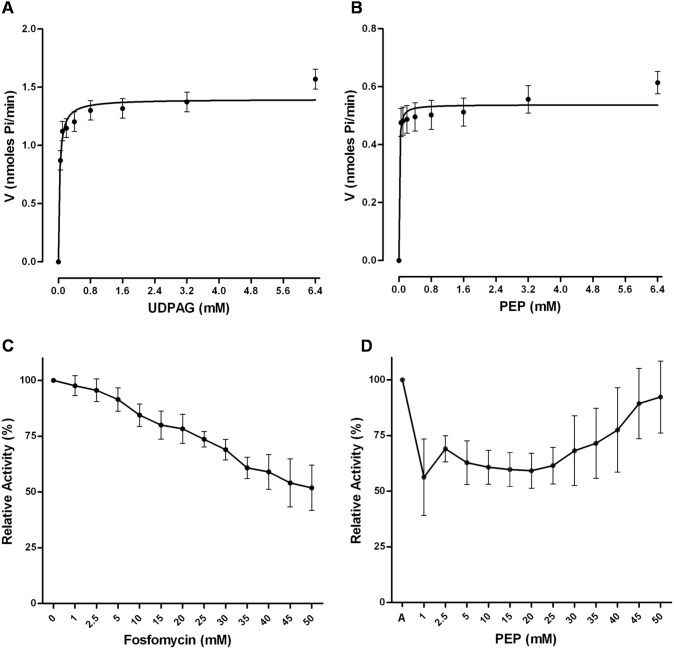
Figure 9. Kinetics profile of wBm-MurA and inhibition of enzymatic activity by fosfomycin.
A: The effect of UDPAG concentration on wBm-MurA activity (K m: 0.03149 mM). B: The effect of PEP concentration on wBm-MurA activity (K m: 0.009198 mM). K m values were calculated by using the Michaelis-Menton plot. C: Relative effect of the fosfomycin on wBm-MurA activity. D: The effect of PEP concentration on the inhibitory activity of fosfomycin, A value on X-axis is without fosfomycin. Each Data point represents an average of the three independent measurements. Error bars represent corresponding SEM.

