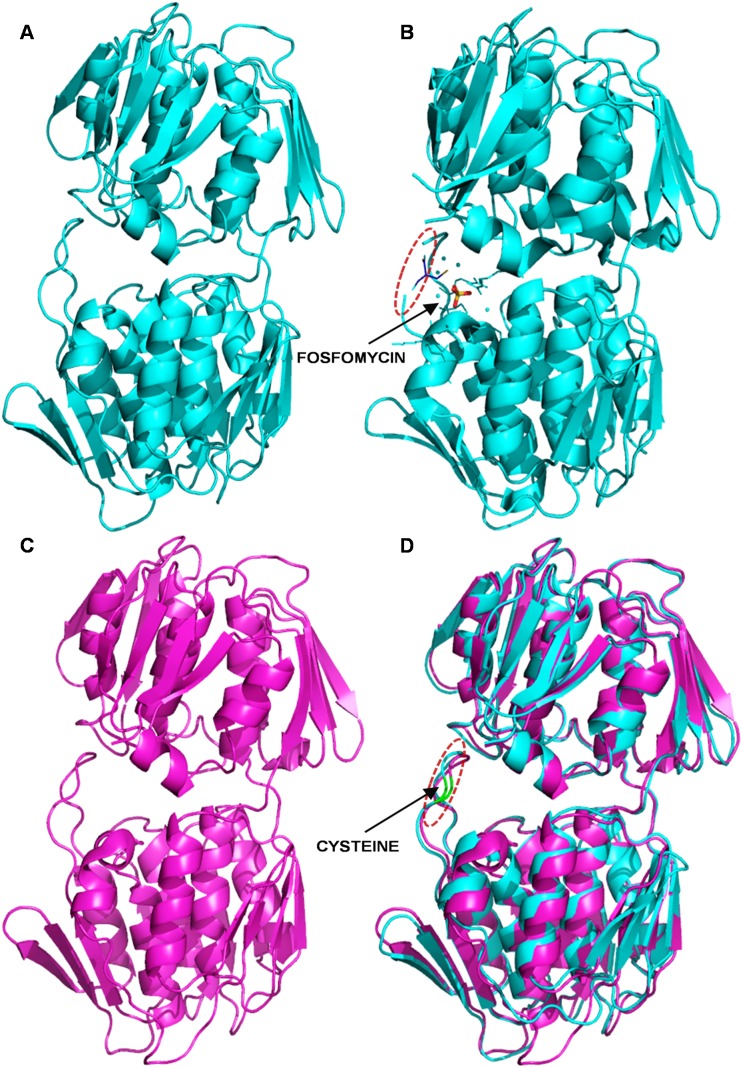
Figure 10. The homology modeling.
A (cyan): Shows the simple unliganded structural model of MurA of H. influenzae (Hi-MurA, PDB: 2RL1). B: Technical view of the fosfomycin interactions during inhibition of the Hi-MurA. C (magenta): 3D refined homology structure model of wBm-MurA. D: Superimposition of the wBm-MurA homology model with the structure model of Hi-MurA. Green stretch (Cys124) in the loop of wBm-MurA model fits with a similar green stretch (Cys115) of Hi-MurA which is the active site for fosfomycin.

