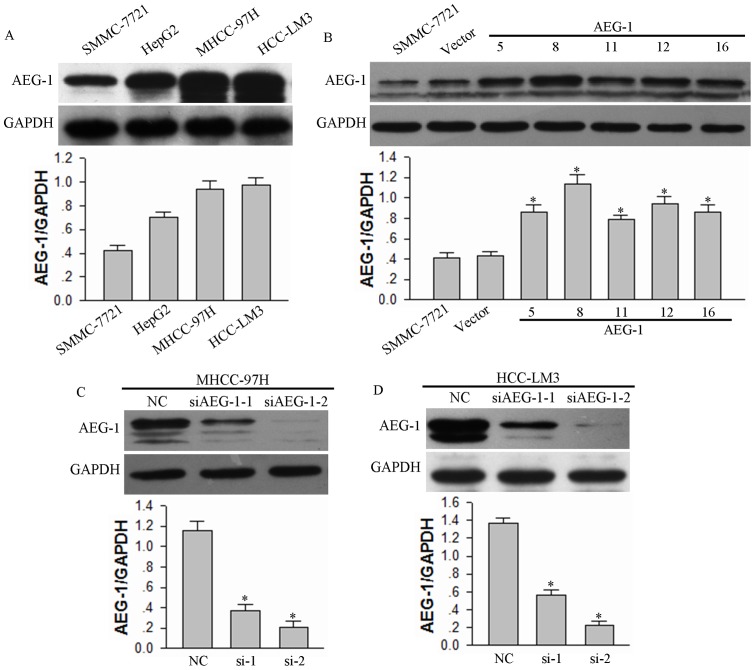
Figure 1. Modulation of AEG-1 expression levels in HCC cell lines.
(A) The endogenous AEG-1 expression in four different HCC cell lines was analyzed by Western Blotting. (B) AEG-1 expression in SMMC-7721 cell lines transfected with pcDNA3.1(−)-AEG-1 plasmid was assessed by Western Blotting. Empty vector was transfected as a control (Vector). (C and D) AEG-1 expression in MHCC-97H and HCC-LM3 cells transfected with siRNA against AEG-1 (siAEG-1-1 and siAEG-1-2) were assessed. Scrambled siRNA was transfected as negative control (NC). GAPDH was used as a loading control for all Western blots, and the mean ±SD of the signal intensity of protein bands for AEG-1 vs. GAPDH in three independent experiments is provided for each experiment. *P<0.05 vs vector control (for panel B) or NC siRNA control (for panels C and D).

