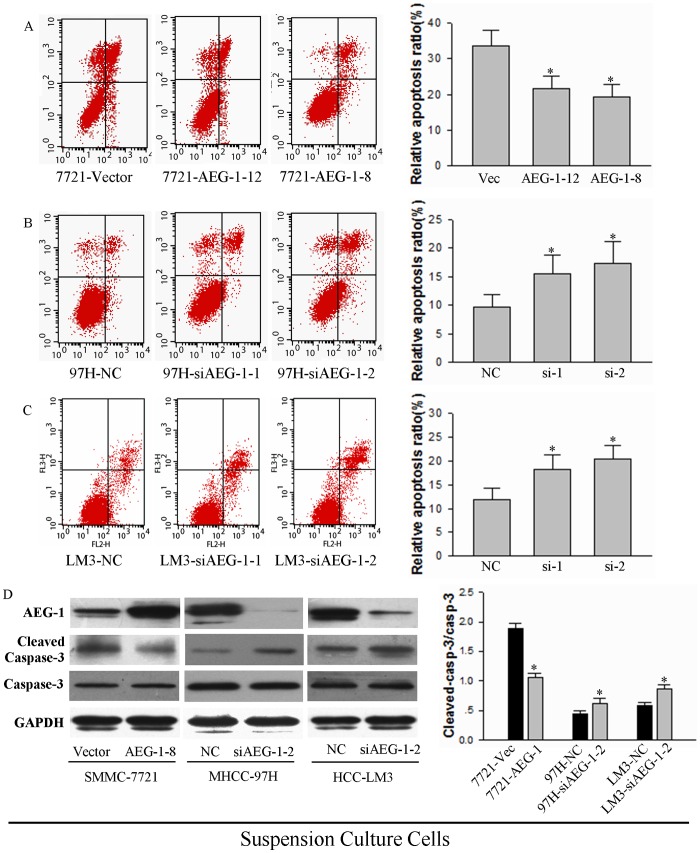
Figure 3. AEG-1 prevents anoikis in HCC cells.
(A, B and C) Anoikis analysis is shown for (A) SMMC-7221 cells expressing either a control vector or two different clones expressing AEG-1; (B) MHCC-97H cells expressing either NC siRNA control or two different siRNAs against AEG-1; and (C) HCC-LM3 cells expressing NC or two different siRNAs against AEG-1. Cells were trypsinized and re-seeded on 2% agar precoated plates. After culture for 24 h, cells were harvested and processed by FACS analysis. Results from a representative experiment are shown (left) and results from three independent experiments (mean±SD) are quantified (right; *P<0.05). (D) Cleaved caspase-3 expression in AEG-1-over-expressing SMMC-7221 cells and AEG-1 knockdown HCC cells. Cells were treated as described above, and then lysates were collected and analyzed by Western blotting for one representative SMMC-7221 AEG-1 over-expressing cell line (AEG-1-8) and one representative siRNA in MHCC-97H and HCC-LM3 cells for AEG-1 knockdown (siAEG-1-2). GAPDH was as assayed as a loading control. Representative results are shown (left), and the mean +SD of the signal intensity of protein bands for cleaved (activated) caspase-3 vs uncleaved caspase-3 in three independent experiments is quantified (right; *P<0.05 vs corresponding vector or siRNA control).

