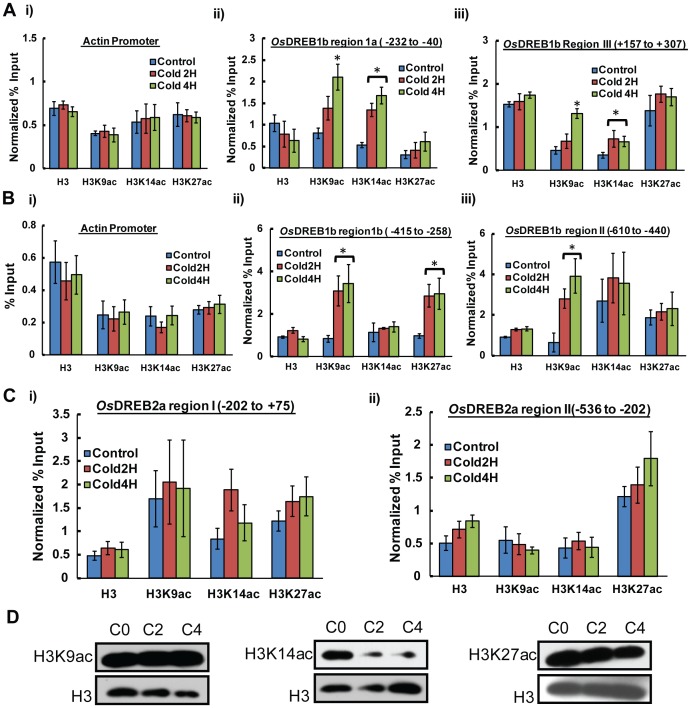
Figure 3. Alteration of histone H3 modifications during cold stress.
Relative change in Histone H3 acetylation (H3K9ac, H3K14ac, and H3K27ac) during cold stress at (A) region Ia (−232 to −40) and region III (+157 to +307) (B) region Ib (−415 to −246) and region II (−610 to −440) of OsDREB1b gene. (C) Relative change in histone modifications at promoter and upstream region of OsDREB2a during cold stress. Samples were analysed by real time PCR except (A). The mean values for each region were normalised to Actin promoter values. Error bar represent standard error (SE) where number of independent experiments (n) = 3. The significance of the results were analysed by student’s t test and the significant changes (P≤0.05) were marked by *. (C) Western blot showing H3K9ac, H3K14ac and H3K27ac signal in whole cell extract isolated from control and cold stress treated rice seedlings.

