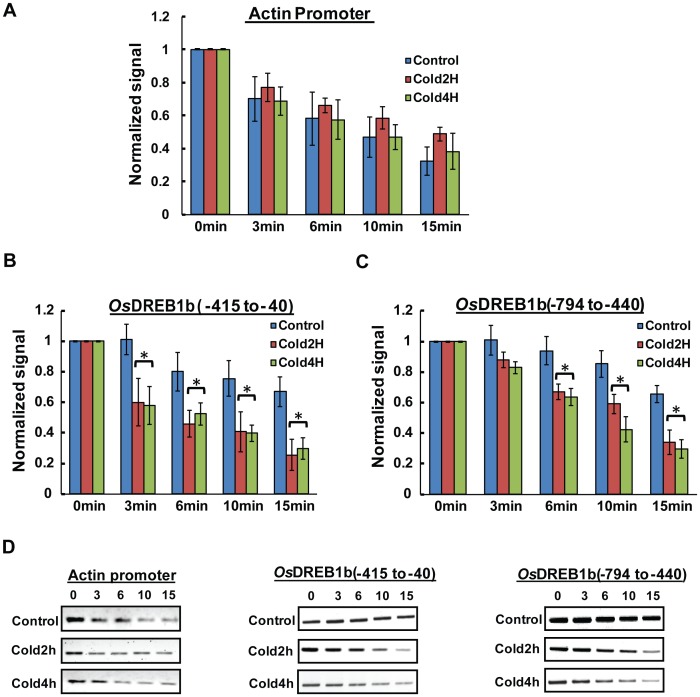
Figure 5. Change in chromatin structure at the promoter and upstream region of OsDREB1b loci using micrococcal nuclease digestion.
MNase accessibility in control and cold stress treated nuclei (2 Hr and 4 Hr) was detected with quantitative PCR based method. Nuclei were digested with MNase (30 U/ml) for increasing time period as indicated. The isolated DNA was used for PCR reaction with primers specific for promoter and upstream region. The amount of DNA amplified at each time point was normalised to that at time 0 and plotted against time to compare the rate of degradation. The data represented here is a mean of three independent experiments with standard error bars and statistically significant values were marked with *. (A and D) rate of degradation for actin promoter; (B, C, D and E) OsDREB1b locus.

