Figure 5.

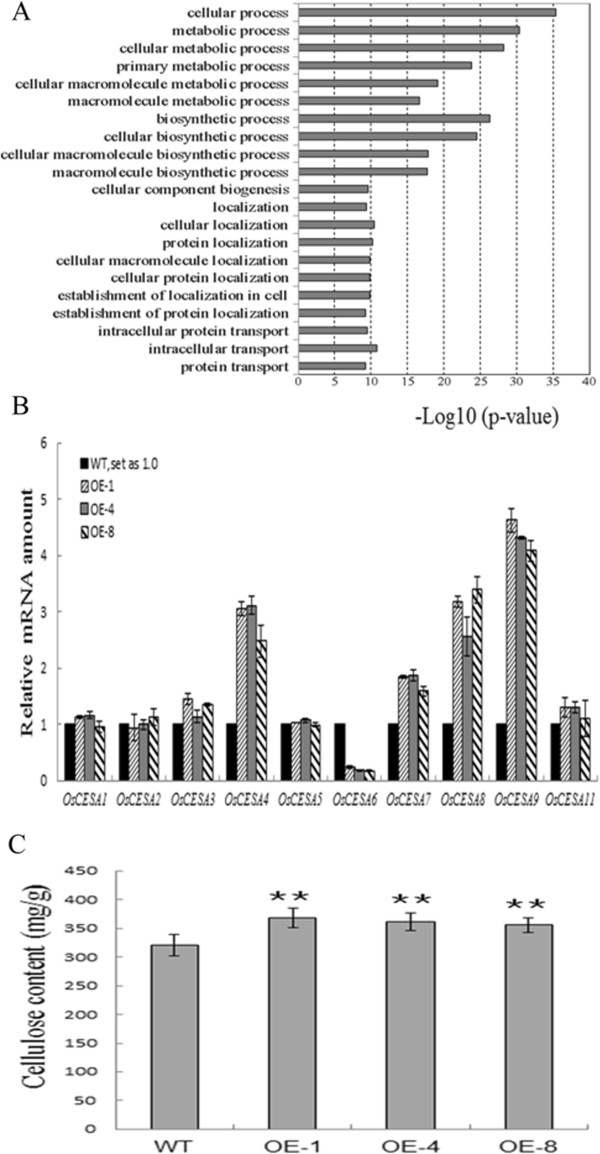
DGE, qRT-PCR and chemical analysis of wild type (WT) and OsMYB103L overexpression (OE) plants. (A) Main clusters identified by GO enrichment analysis of genes up-regulated in OE compared with WT. In each GO biological process category, the bar indicates the fold enrichment, which is defined as -Log10 (P value). The up-regulated genes are involved in multiple biological processes, such as metabolism, biogenesis, localization and transport. (B) Relative expression of rice CESA genes in WT and OE was determined by qRT-PCR analysis. The transcript levels of genes were normalized to the levels of ACTIN1 gene expression. The transcript levels of these genes in WT were arbitrarily set to 1. Values are the mean ± SD of three replicates. (C) Measurement of cellulose content in WT and OE. Cellulose content (milligrams per gram of total cell wall residues) of the flag leaf segments from WT and OE plants. The error bars were obtained from five measurements. Asterisks (**) indicate a significant difference between transgenic plants and WT controls at P < 0.01, by Student’s t-test.
