
Figure 1.
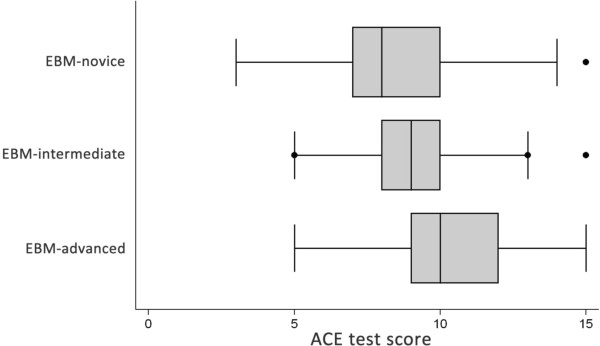
Box and whisker plot of ACE scores across EBM-novice (n = 98), EBM-intermediate (n = 108) and EBM-advanced (n = 136) participants. ANOVA for linear trends demonstrated statistical significance (p < 0.0001).
Official websites use .gov
A
.gov website belongs to an official
government organization in the United States.
Secure .gov websites use HTTPS
A lock (
) or https:// means you've safely
connected to the .gov website. Share sensitive
information only on official, secure websites.
Box and whisker plot of ACE scores across EBM-novice (n = 98), EBM-intermediate (n = 108) and EBM-advanced (n = 136) participants. ANOVA for linear trends demonstrated statistical significance (p < 0.0001).