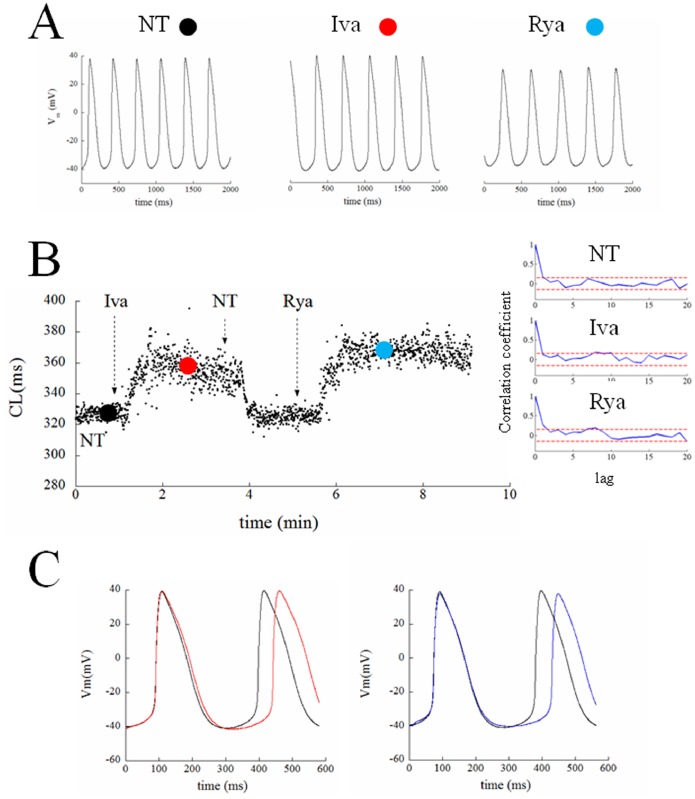
Figure 2. Chronotropic effect of ivabradine and ryanodine.
Panel A: Series of APs were recorded from a patch clamped SANC, first perfused in NT, then in 3 µM ivabradine, then back in NT (not shown), and finally in 3 µM ryanodine. Switching times are reported as vertical arrows. Time was allowed for AP parameters to reach the steady state in each perfusion condition, and 2 s samples of each sequence were taken and reported here. Panel B: The time course of CL of the entire experiment is reported on the left. Colored dots represent the times when the 2 s sequences of Panel A were taken. Three sequences of 158 beats were taken from the three regions ending with the colored dots, and underwent autocorrelation analysis of lags of 1–20 beats; results are shown in right Panel. C: Representative examples of the observed bradycardic effect of ivabradine (left) and ryanodine (right) on APs (black: controls; red: ivabradine; blue: ryanodine).

