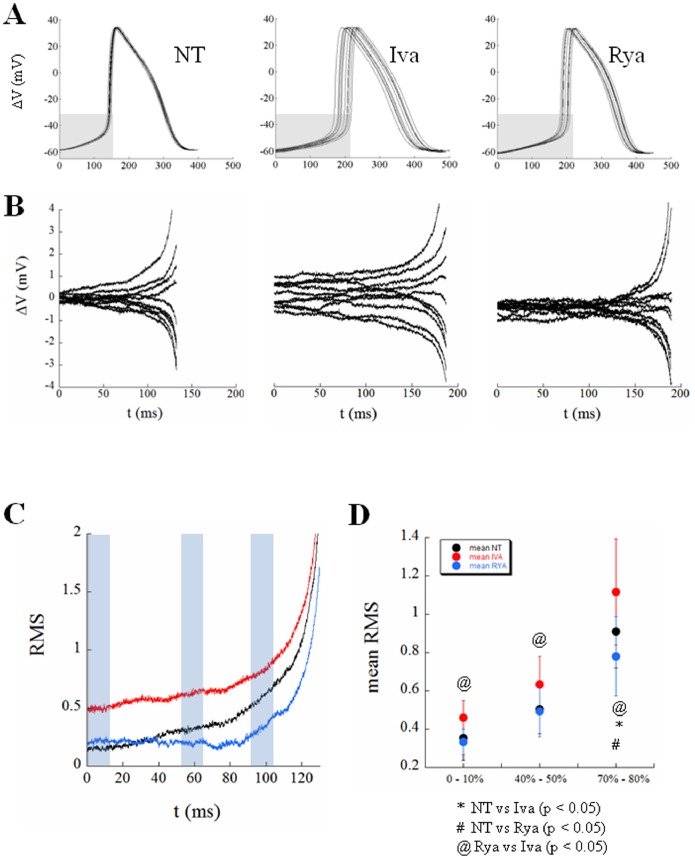
Figure 10. Beat-to-beat noise during DD.
Panel A: Ten consecutive APs, time-aligned with the preceding MDP, are reported in each panel from a cell perfused, in turn, with NT, Iva, and Rya. Panel B: The DD phase (from MDP to TOP, corresponding approximately with the grey region in Panels A) was extracted from each curve and the average DD trace calculated for each treatment. The curves measured as the difference between each DD trace and the average DD trace are reported for each treatment. Panel C: The root mean square (RMS) of differences at each time was then calculated for NT (black trace), ivabradine (red), and ryanodine (blue), and all reported normalized to the duration of DD in NT. Panel D: RMSs of differences were then calculated for each one of the 7 cells under study, and the average results summarized for 3 different regions of DD, marked with light blue rectangles in Panel C, and reported in Panel D as mean ± SE.

