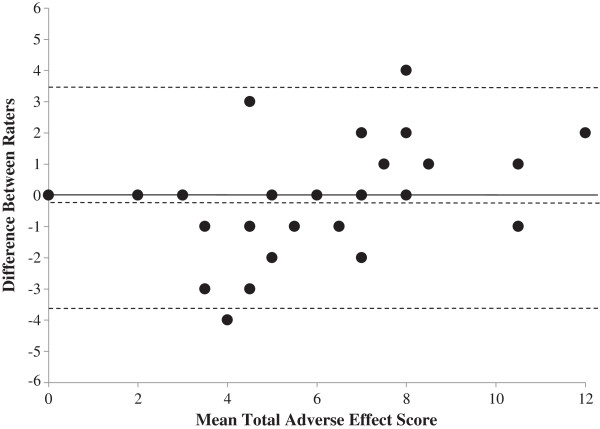
Figure 1.

Bland-Altman Plot for Immunosuppressive Adverse Effects Scoring System. This figure presents the inter-rater agreement of n = 32 renal transplant recipients for the adverse effects scoring system with the difference between raters on the y-axis and the mean total adverse effect score for each patient on the x-axis. Each solid dot represents one patient (Note: there are 7 overlapping data points). The dotted lines represent the mean difference between the two raters (−0.15; middle line) with the upper and lower bounds of 2 standard deviations around the mean (−3.59, +3.28). There is little systematic bias or variability between raters.
