Figure 12.

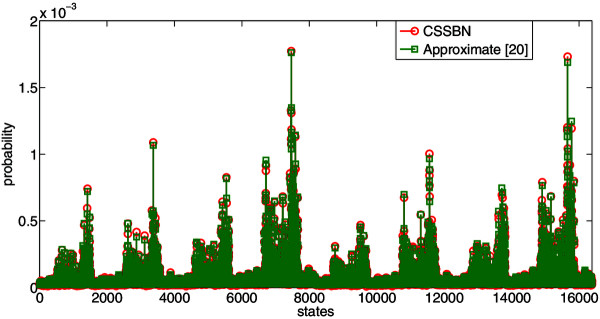
The steady state distributions (SSDs) of the glioma network obtained using the CSSBN time-frame expansion technique and the approximate analysis [20].L = 800k bits.

The steady state distributions (SSDs) of the glioma network obtained using the CSSBN time-frame expansion technique and the approximate analysis [20].L = 800k bits.