Figure 7.

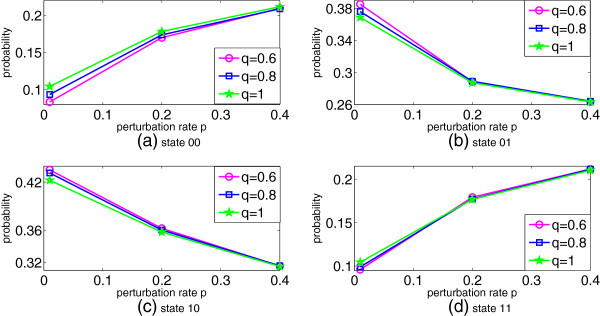
The steady state distribution (SSD) of the p53-Mdm2 network for different perturbation rate, p, and context switching probability, q. The steady-state probabilities are shown for (a) state 00, (b) state 01, (c) state 10, and (d) state 11. (L = 500k bits).
