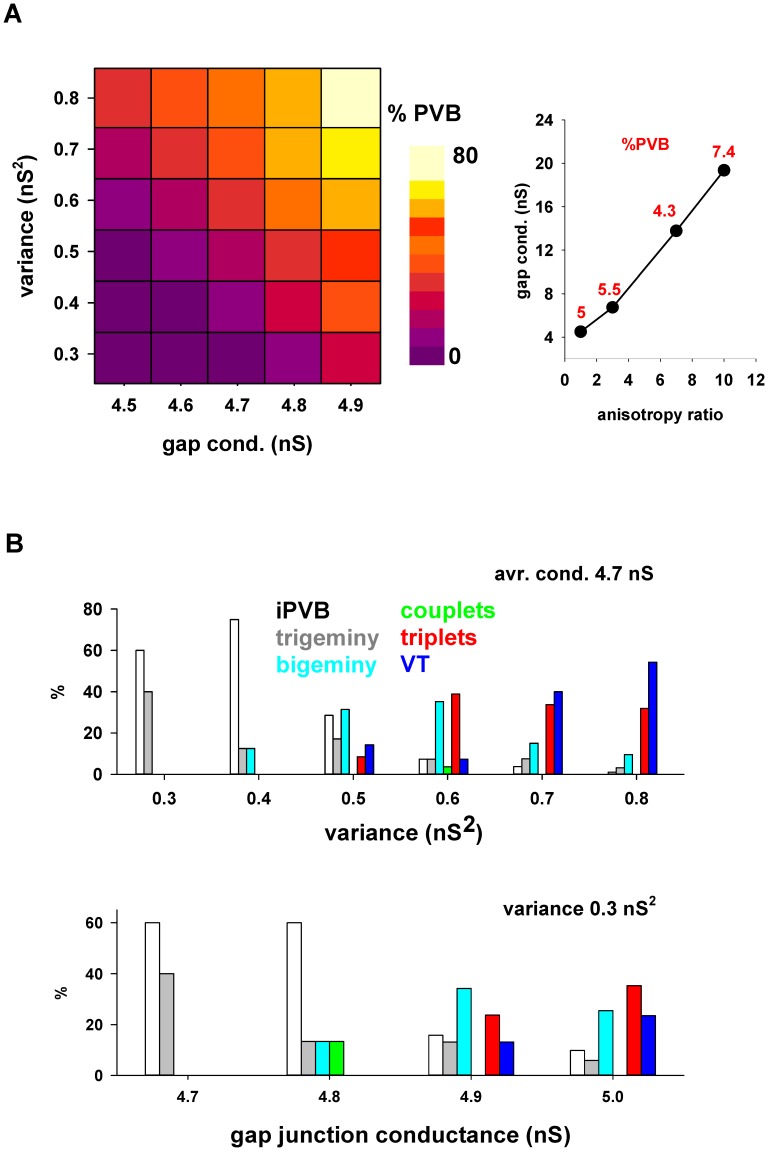
Figure 5. Gap junction modulations and fluctuations inside an ischemic area determine the relative proportion of premature beats.
A) Percent of premature beats, with respect to the total number of beats, generated by different average and variance values of the gap junction conductance inside the ischemic area; B) Distribution of abnormal events as a function of the variance (top graph) or the average value (bottom graph) of the gap junctions conductance inside the ischemic area. White bars represent iPVB.

