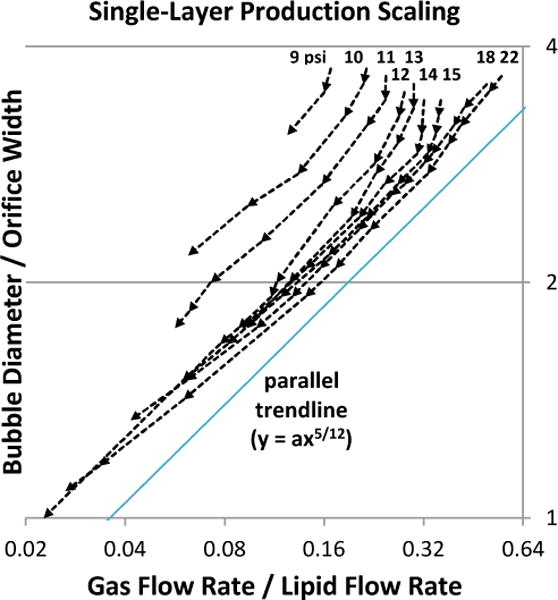
Fig. 3.

Effect of gas pressure on size scaling. Orifice width measured ~5.7 μm. Oil was not used. Lipid flow-rate sweeps were performed at nine gas pressures (9–15, 18, and 22 psi), with arrows denoting the sequence of increasing lipid flow. Production transitioned gradually from geometry-controlled to dripping, becoming the latter definitively below y = 2. At each pressure, scaling roughly followed a power trend of y = ax5/12 (a = 4 shown), similar to observations by Castro-Hernández et al.30 Here, however, a was found to vary with gas pressure.
