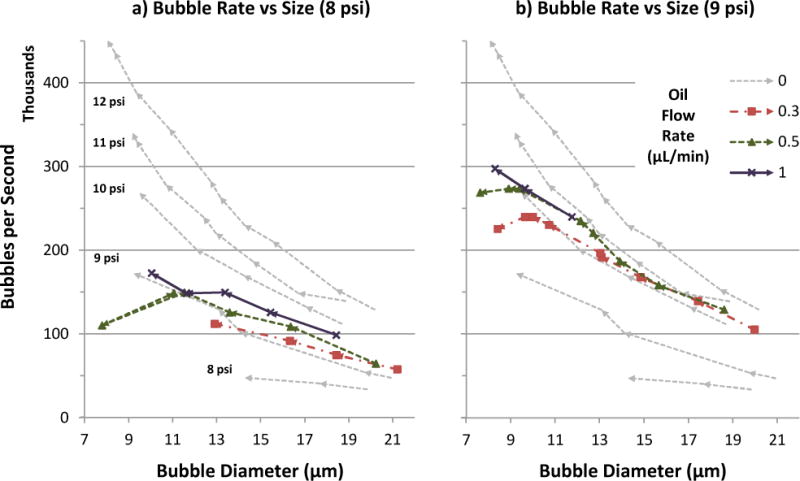
Fig. 5.

Bubble production rate vs. diameter over a range of lipid and oil flow rates, at gas pressure 8 psi (a) or 9 psi (b). For reference, oil flow 0 (single-layer lipid bubble) data was taken at five gas pressures (8–12 psi), and included in both graphs. In each data series, arrows denote the sequence of increasing lipid flow. Production curves generally exhibited inverse power law trends (axk, where k < 0), but inclusion of oil added a dip at high flow rates prior to production destabilization. Oil also shifted production curves upward, similar to a gas pressure increase of 1–2 psi.
