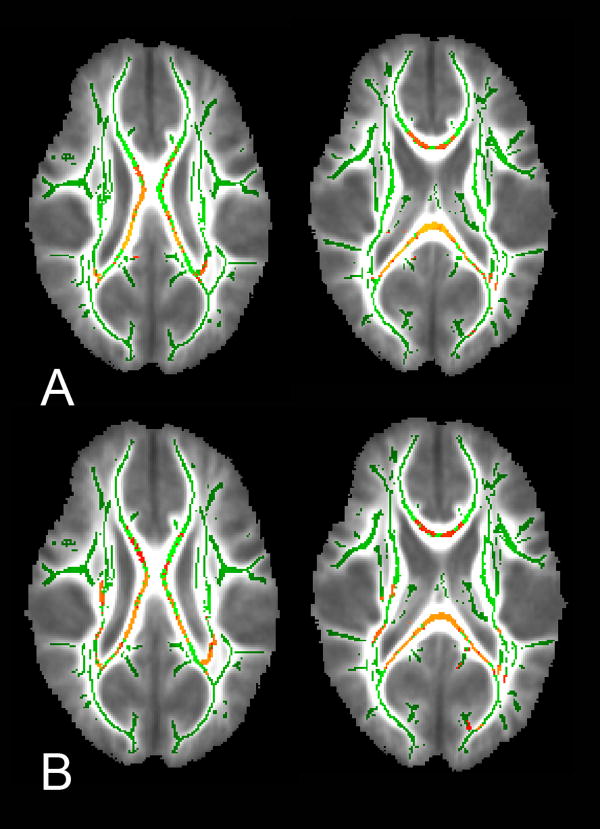
Figure 3. TBSS results comparing VPT children with and without WMA.
TBSS results denoting areas of the CC that differed significantly between VPT children scanned at 7 years of age with and without WMA on neonatal MRI. Results demonstrate (A) higher FA and lower RD (B) in the CC in subjects without WMA. Yellow color denotes areas that differ between groups (p ≤ 0.05). Green color indicates areas with no difference. Results overlaid on averaged FA map.

