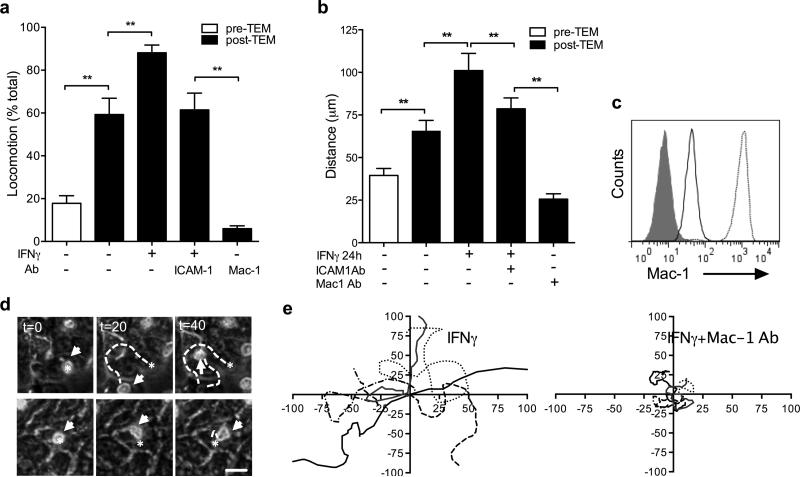
Figure 2.
(A-B) Following TEM, PMN were allowed to apically adhere to IECs grown in the bottom chamber of transwells. The number of PMN exhibiting locomotion (A) and the traveled distances (B) were visualized and quantified in the presence or absence of the appropriate IgG control, or anti-ICAM-1 and Mac-1 function blocking Abs (20μg/ml), using phase contrast time lapse microscopy (Zeiss, Axiovert microscope) and ImageJ software. (C) PMN before (solid black line) and after TEM (dotted line) were analyzed for Mac-1 expression using flow cytometry. Representative flow diagram (n=4) shows robust upregulation of Mac-1 on PMN surface after TEM. The filled area represents control IgG staining. (D) Image sequence depicting representative PMN exhibiting locomotion on T84 IECs in the absence (upper panels) and in the presence of Mac-1 blocking antibody (bottom panels). Stars indicate initial PMN position, white arrows track PMN movement. The dashed lines highlight the path traveled by PMN over 40 minutes. The bar is 20μm. (E) Movement trajectories (in μm) of 6 representative PMN from 3 independent experiments over 40 minute time periods on the apical surface of IFNγ stimulated T84 IECs in the absence (upper panels) and in the presence of Mac-1 blocking antibody (bottom panels). N=4 independent experiments in duplicates, **(p<0.01), ANOVA with Newman-Keuls multiple comparison test (A,B).

