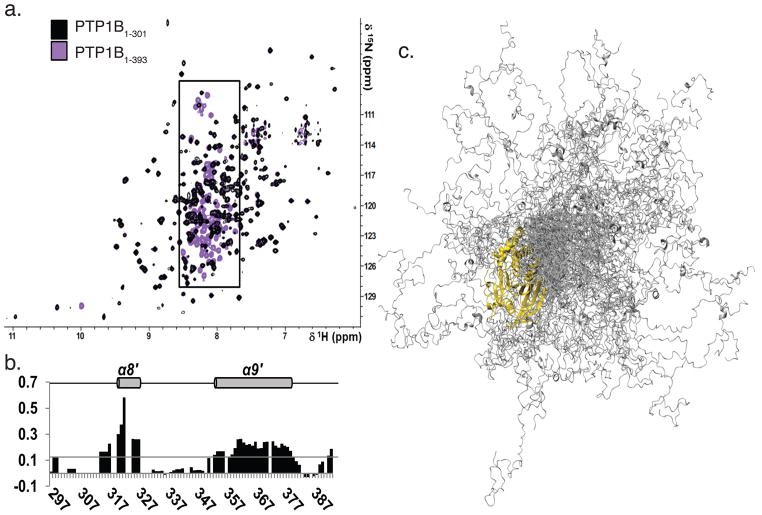
Figure 3. PTP1B residues 300-393 were flexible and predominantly disordered.
a. Overlay of the 2D [1H,15N] TROSY spectra of PTP1B1-301 (black) and PTP1B1-393 (purple). Boxed region (7.5 - 8.5 ppm, 1H dimension) marks PTP1B residues 300-393.
b. Secondary structure propensity (SSP) scores for PTP1B residues 300–393. A score of 1 indicates a fully populated α-helix, while a score of 0.5 indicates an α-helix that is ~50% populated in solution. Helices α8′ and α9′, which are 20 % populated, are denoted with a gray cylinder and labeled above.
c. Representative ensemble of 100 conformers that are superimposed over PTP1B residues 1–284 (gold). PTP1B residues 285–398 (gray) sample a wide range of conformational space.

