Figure 14.

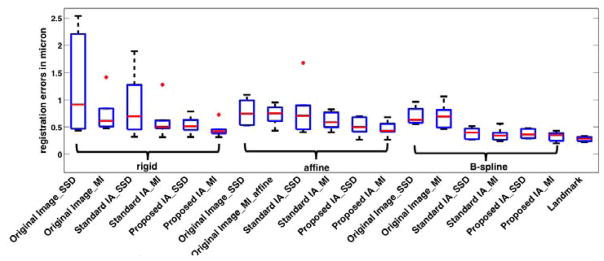
Box plot for the registration results of TEM/confocal images for different methods. The bottom and top edges of the boxes are 25th and 75th percentiles, the central red lines indicate the medians.

Box plot for the registration results of TEM/confocal images for different methods. The bottom and top edges of the boxes are 25th and 75th percentiles, the central red lines indicate the medians.