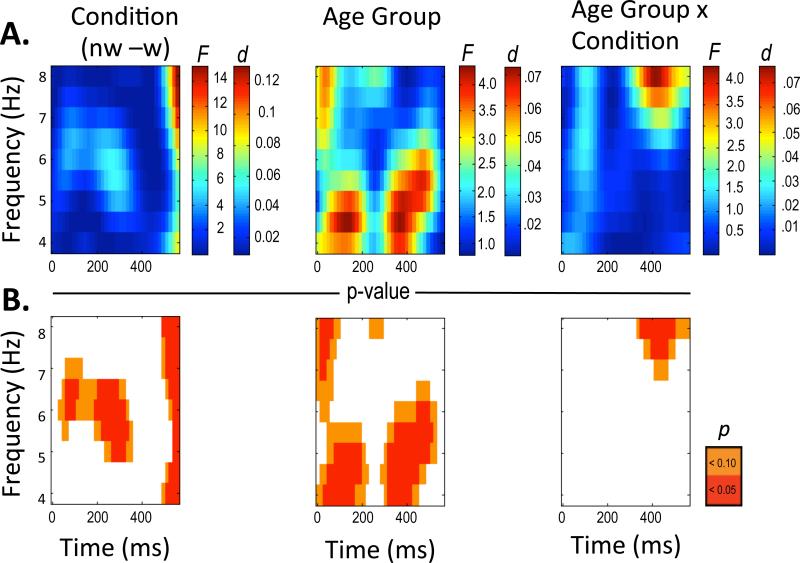
Figure 3.
Plotted ERSP statistical results from .5 Hz by 16 ms repeated measures ANOVAs with F-values and effect size for Condition, Age and Condition by Age Interaction (panel A). Plotted uncorrected p-values for Condition, Age and Condition by Age Interaction at p < .05 (red) and p< .10 (orange) (panel B).

