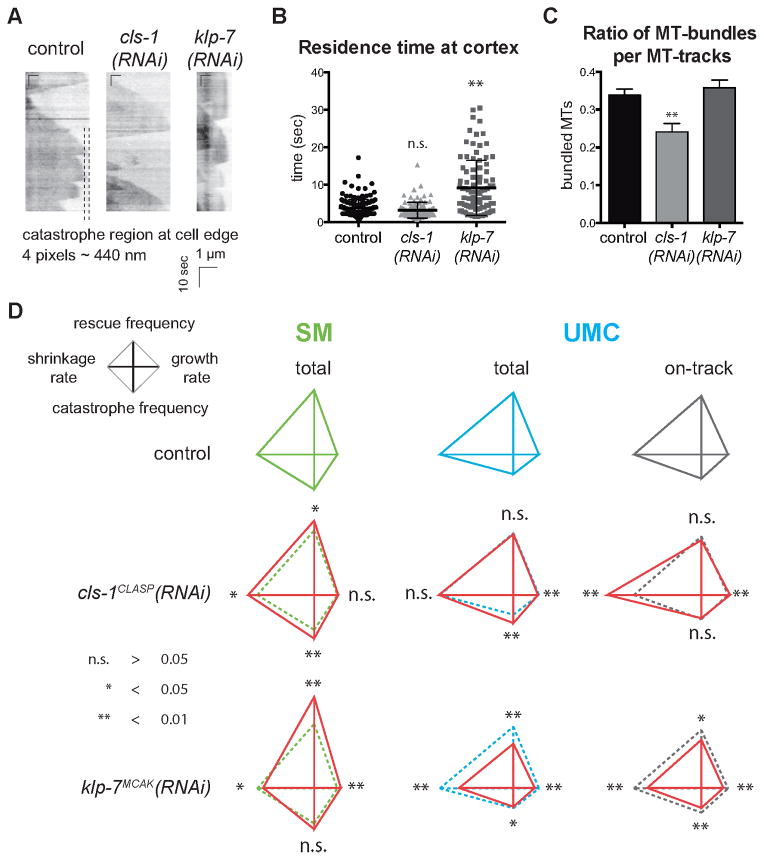
Figure 6. Depletions of two conserved MAPs selectively affect MT dynamics in a stage-dependent manner.
(A) Kymographs of MTs in the dorsal extension of UMCs in control worms and those depleted of CLS-1CLASP or KLP-7MCAK. (B) The residence time of MTs at the cortex is displayed in the scatter plot. Error bars = SEM, n > 30 MTs in 6 worms. ** p value < 0.01. (C) Histogram: ratio of MTs growing in bundles compared with the total number of MTs observed. Error bars = SEM, n > 30 MTs in 6 different worms. ** p value < 0.01. (D) Red diamond graphs of MT dynamics in CLS-1CLASP or KLP-7MCAK depleted SM and UMCs are superimposed with the non-depleted controls (dashed lines). Green: SM, cyan: total MT-population in UMCs and grey: dynamics of on-track or bundled MTs in UMCs. p value: * < 0.05; ** < 0.01 and n.s. > 0.05, unpaired t test.

