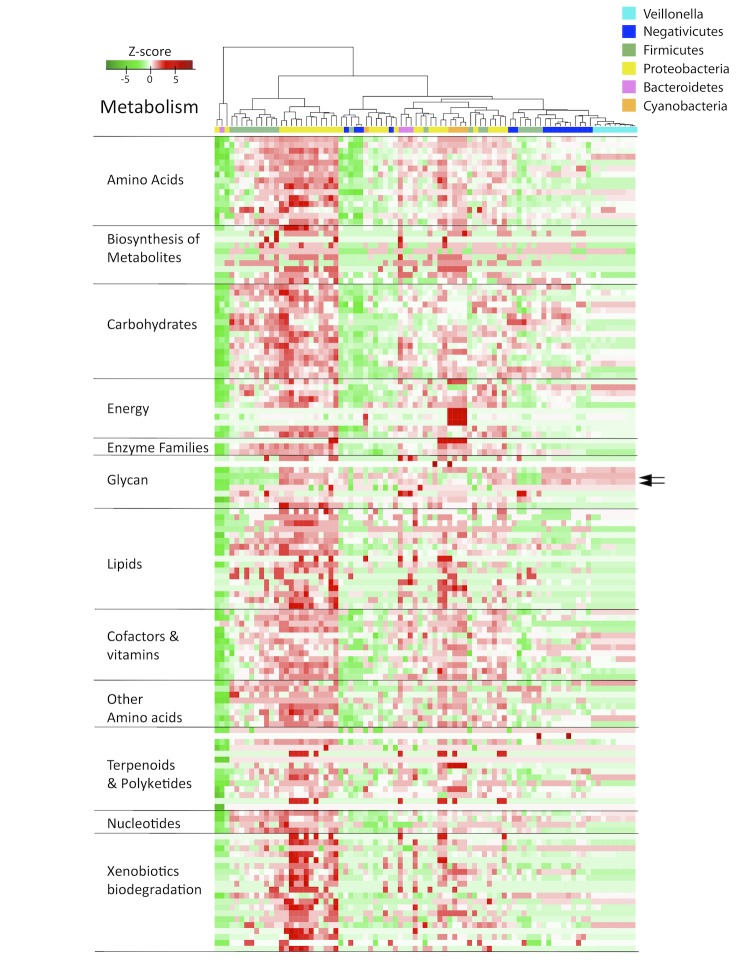
Figure 5.
Heatmap of metabolism potential, based on Kyoto Encyclopedia of Genes and Genomes ontology (KEGG). The green color in the heatmap indicates weak metabolic potential, while red signals strong potential. The arrows to the right indicate the scores for lipopolysaccharide biosynthesis. A version summarizing the metabolism pathways and showing the species legend is available as supplementary material.

