
Figure 3.
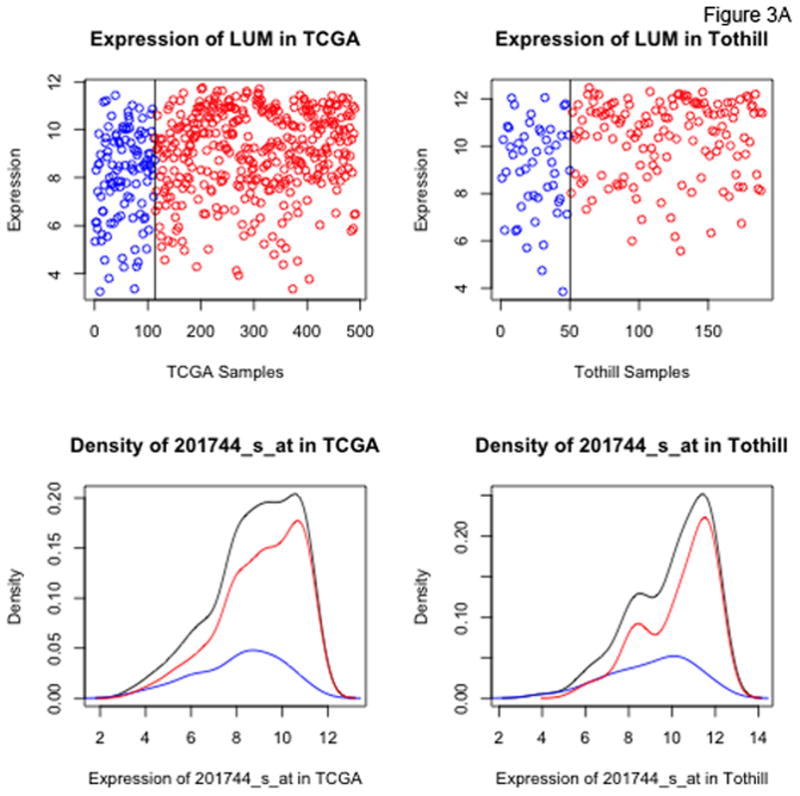
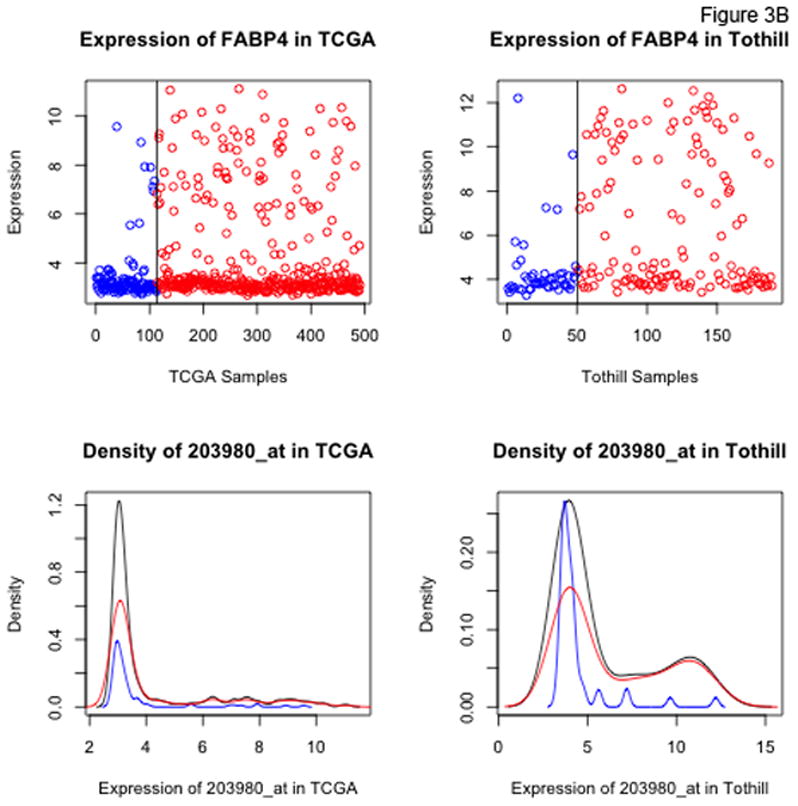
Dot and density plots for LUM, lumican (Panel A) and FABP4 (Panel B) in the TCGA and Tothill datasets. Cases with no residual disease (R0) are in blue, cases with residual disease in red. Black density curves represent the entire cohort.
Official websites use .gov
A
.gov website belongs to an official
government organization in the United States.
Secure .gov websites use HTTPS
A lock (
) or https:// means you've safely
connected to the .gov website. Share sensitive
information only on official, secure websites.
Dot and density plots for LUM, lumican (Panel A) and FABP4 (Panel B) in the TCGA and Tothill datasets. Cases with no residual disease (R0) are in blue, cases with residual disease in red. Black density curves represent the entire cohort.