
Figure 4.
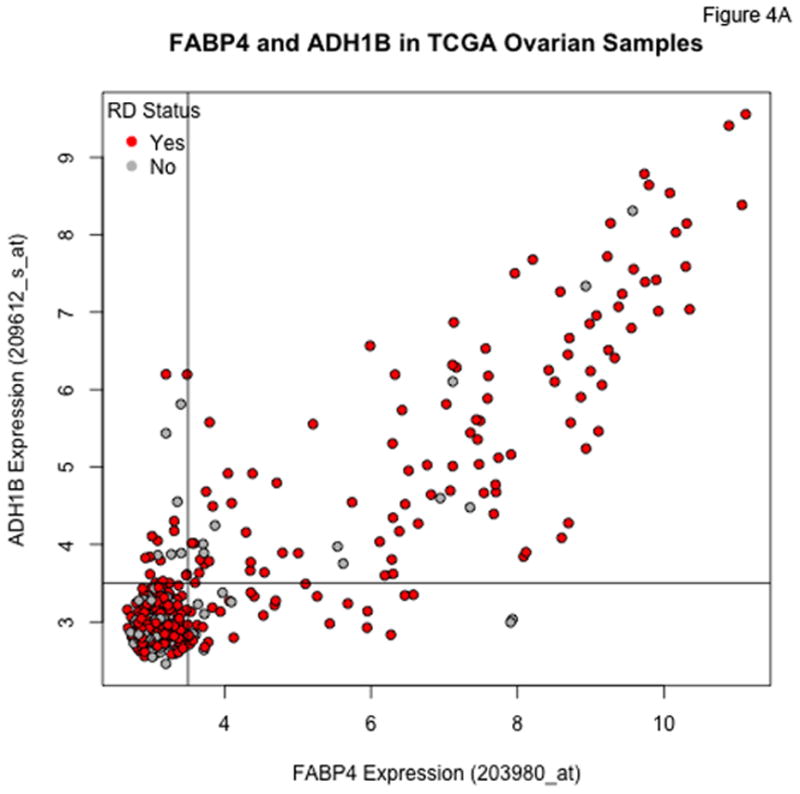
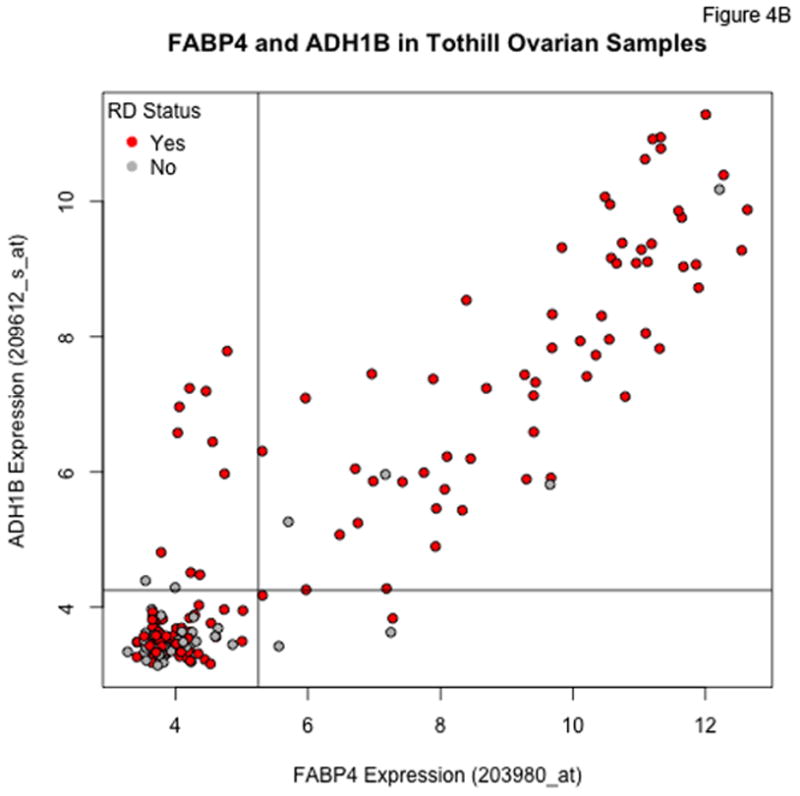
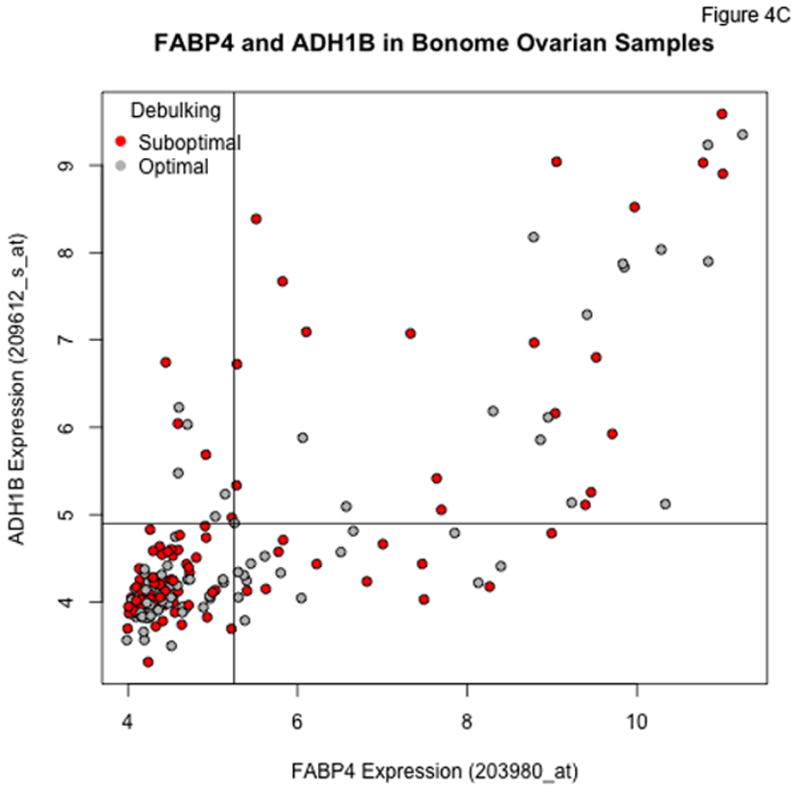
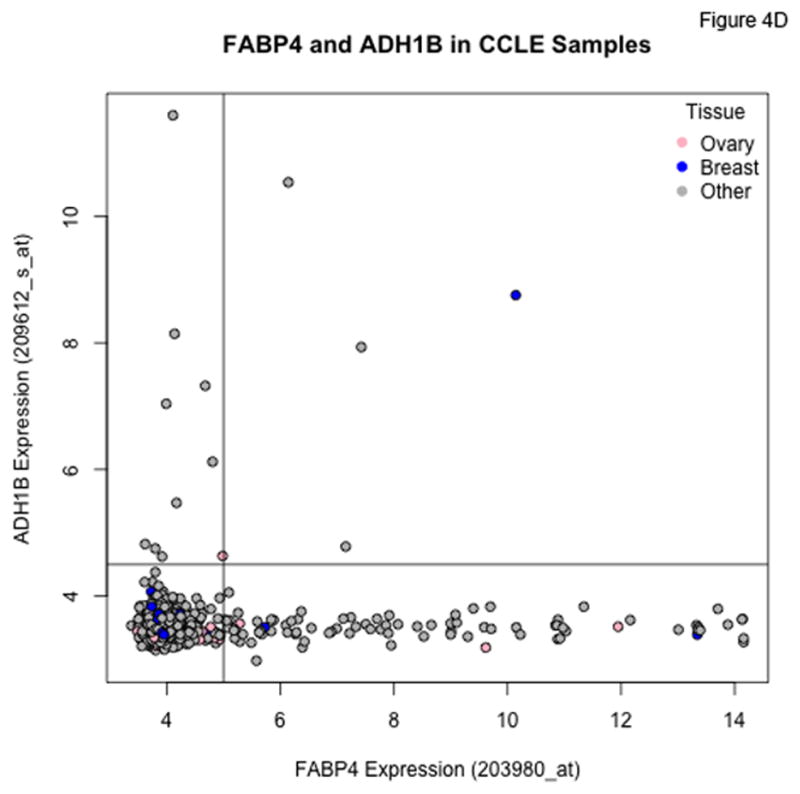
Plots of FABP4 against ADH1B for the TCGA (Panel A), Tothill (Panel B), Bonome (Panel C), and CCLE (Panel D) datasets. Cutoffs separating “low” and “high” expression were chosen by eye, and loosely correspond to dips in density estimates of the corresponding distributions. The genes track together in the TCGA and Tothill cohorts, and rates of residual disease are higher when both genes are elevated. Tracking is more diffuse in the (microdissected) Bonome samples, and essentially absent in the CCLE samples, suggesting the linkage may be driven by the microenvironment.