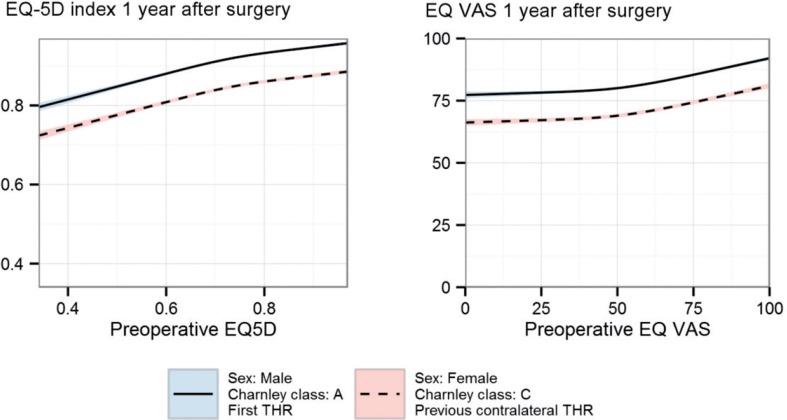
Figure 2.
The relationship between the EQ-5D index and the EQ VAS one year after surgery in relation to preoperative values. The 2 lines differ only in height. The solid line with blue confidence interval indicates the optimal combination of covariates (male sex, first hip, and Charnley class A) while the dotted line with pink confidence interval indicates the least favorable combination (female sex, second hip, and Charnley class C). Age and pain were set to the median values, 69 years and 65 mm.

