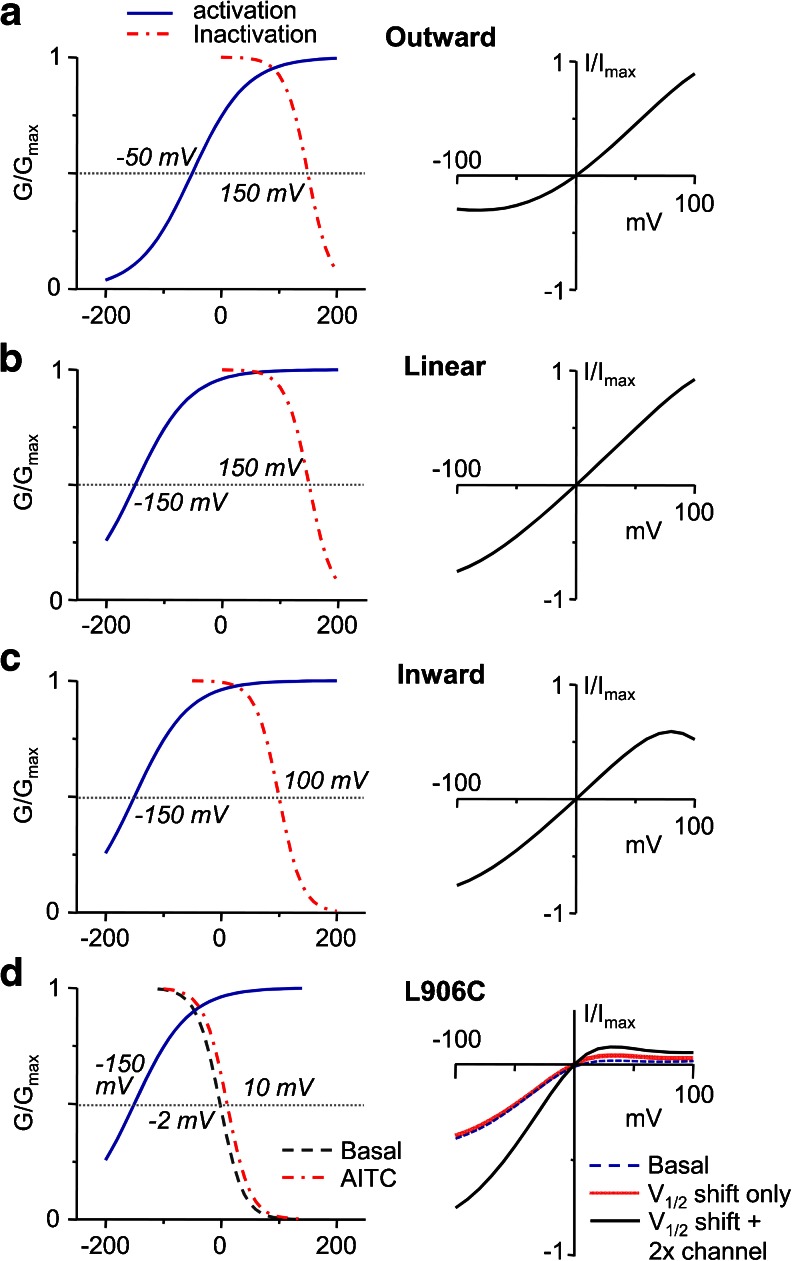
Fig. 10.
Simulation of I–V relationships of TRPA1 using the bimodal voltage-dependent gating model. Left plots show G–V curves for activation (solid blue) and inactivation (dot-dash red) using V 1/2 values as indicated and other parameters described in “Materials and methods.” Right plots show I–V curves between −100 and +100 mV predicted from the G–V relationships at the left side. a–c For wild-type TRPA1, outward rectification (a), linear I–V (b), and inward rectification (c) can be generated by separately changing the V 1/2 values for activation and inactivation without altering any other parameter. d For L906C, the characteristic inwardly rectifying I–V relationship can be predicted using the measured inactivation V 1/2 values for basal (dashed blue) and AITC stimulated (solid red) conditions from Fig. 4e. The activation V 1/2 is assumed to be very negative (<−150 mV). However, to account for the increased current density in response to AITC, channel availability needs to be doubled (solid black)

