Fig. 5.
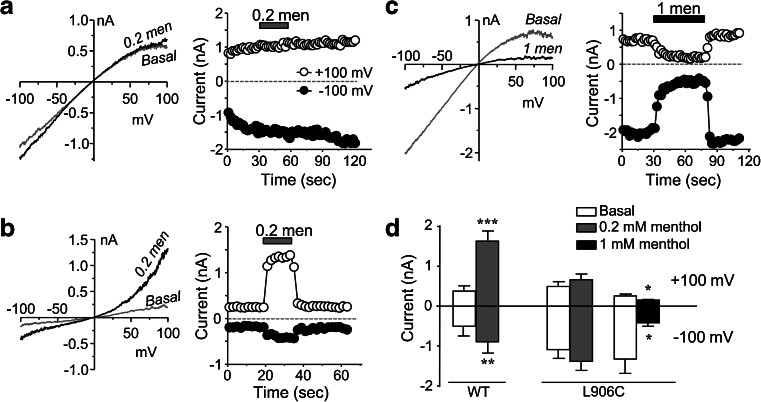
Effect of menthol on L906C. a, b Representative I–V traces (left) and time courses at +100 and −100 mV (right) of whole-cell currents obtained by voltage ramps from cells that expressed L906C mutant (a) and the wild-type (b) constructs of TRPA1. Menthol (men, 0.2 mM) was applied as indicated. I–V traces show basal and during menthol application. c Similar to a, but 1 mM menthol was applied to the cell that expressed L906C, which caused inhibition. d Summary data (means ± SEM, n = 6) for experiments shown in a–c. *p < 0.05, **p < 0.01, ***p < 0.001 vs basal by paired t test

