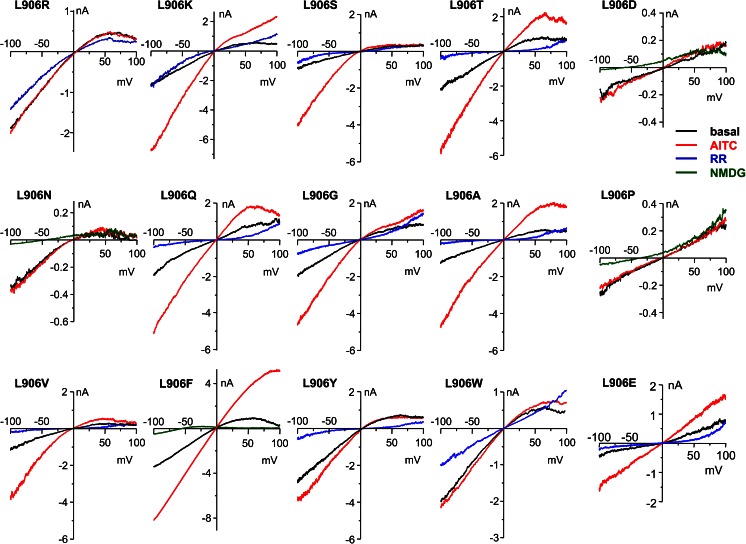
Fig. 8.
I–V relationships of L906 mutants. Representative I–V traces obtained using voltage ramps from −100 to +100 mV at basal (black), peak of stimulation by AITC (100 μM, red), after addition of ruthenium red (RR, 10 μM, blue), or replacement of cations in the bath solution with NMDG+ (green) for HEK293 cells that expressed L906 mutants of mouse TRPA1 as indicated. Whole-cell recordings were performed using the Ca2+-free bath solution as described in “Materials and methods.” Summary data for current densities and rectification ratios under basal and AITC-stimulated conditions are shown in Fig. 7a, b

