Figure 1.
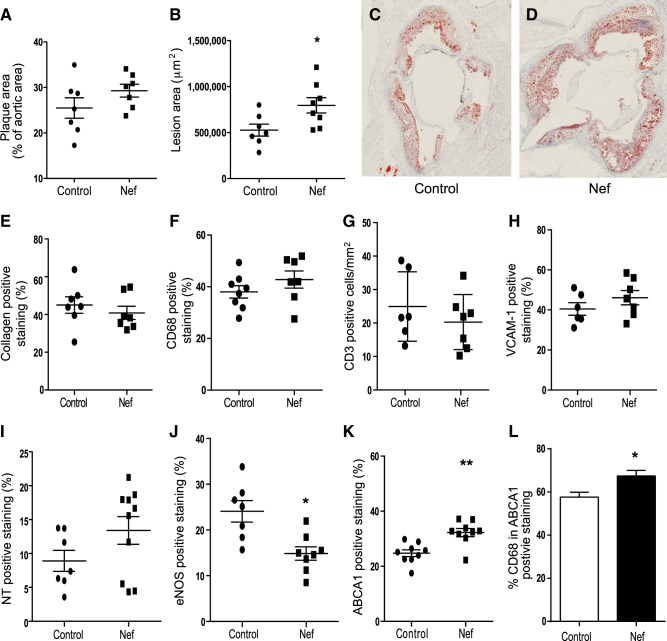
Effect of Nef on development of atherosclerosis in apoE−/− mice. A) Percentage of atherosclerotic lesions in the total aorta. En face analysis, percentages calculated as an area stained with Sudan IV divided by total area. B) Quantitation of the area occupied by lesions in cross-sections of the aortic sinus region after staining with Oil Red O. *P < 0.03 vs. vehicle. C) Representative section of an aortic sinus from a control mouse stained with Oil Red O. D) Representative section of an aortic sinus from a mouse treated with Nef stained with Oil Red O. E) Analysis of the abundance of collagen within the aortic sinus region after staining with Masson's trichrome stain. F) Analysis of macrophage infiltration within the aortic sinus region after staining with anti-CD68, G) Analysis of T-cell infiltration within the aortic sinus region after staining with anti-CD3. H) Analysis of the abundance of VCAM-1 in sections from the aortic sinus region. I) Analysis of the abundance of the nitrotyrosine (NT) in the aortic sinus region. J) Analysis of the abundance of the eNOS in the aortic sinus region. *P < 0.01 vs. vehicle. K) Analysis of the abundance of ABCA1 within the aortic sinus region. **P < 0.03 vs. vehicle. Values represent positive staining as a percentage of total lesion area. L) Costaining of ABCA1 and CD68. *P < 0.05.

