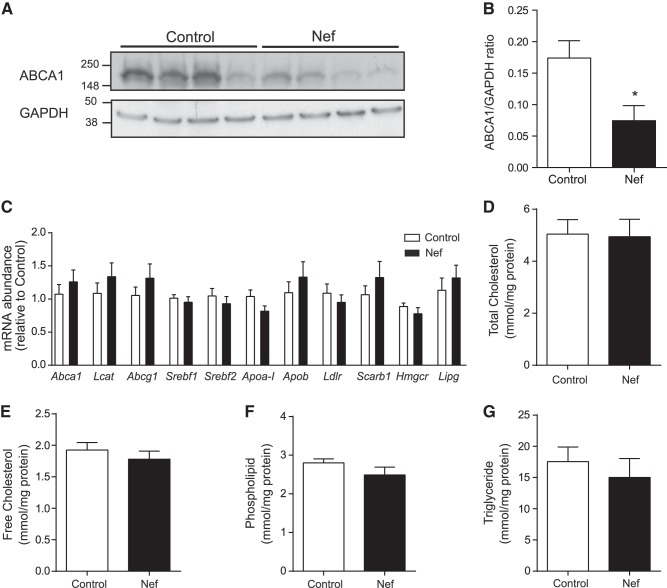
Figure 4.
Effect of Nef on expression of genes related to lipid metabolism in liver of apoE−/− mice. A) Western blot of ABCA1 abundance in the liver of 4 control and 4 Nef-treated mice. B) Quantitation of ABCA1 abundance in the liver of control and Nef-treated mice. *P < 0.05, n = 7/group. C) Expression of genes related to lipid metabolism in liver of apoE−/− mice. D–G) lipid composition of liver: TC (D), free cholesterol (E), phospholipid (F), and triglyceride (G).

