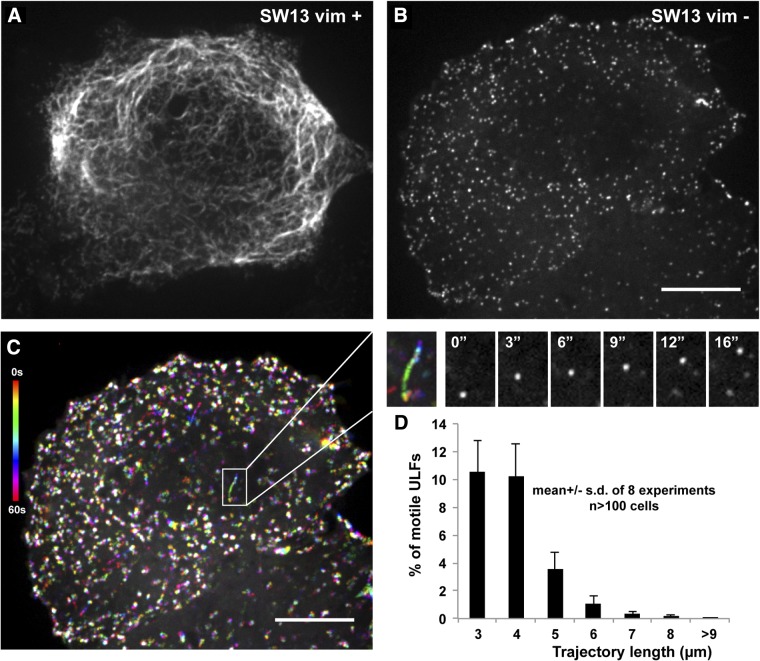
Figure 1.
Movement of vimentin ULFs in SW13 cells. A, B) GFP-tagged Y117L mutant vimentin was expressed in SW13 vim+ cells containing endogenous vimentin (A) or in vimentin-deficient SW13 vim− (B). C) Temporal color-code representation of GFP-ULF movement in a cell shown in B. Images were captured every second for 1 min, then color coded and merged for a qualitative representation of ULF trajectories. Time color-code bar is at left. Rainbows correspond to motile ULFs, and white dots correspond to stationary ULFs. Enlargement of the boxed area (at right) shows an example of a linear trajectory (rainbow picture) and the corresponding image sequence. See also Supplemental Movie S1. Scale bar = 10 μm. D) Trajectories of ULFs were analyzed using Diatrack software in ≥10 cells/experiment. Graph shows the mean frequency distribution of trajectory length for trajectories that are ≥3 μm long.

