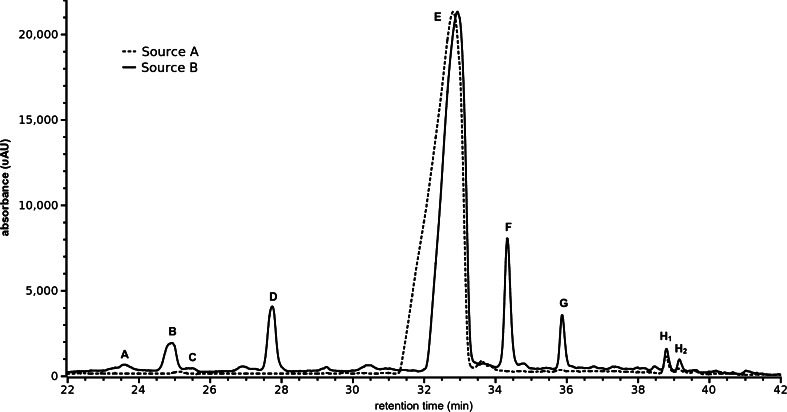
Figure 3.
Chromatograms (λ = 340 nm) for samples from sources A and B; outside the retention times shown here, only the background signal is observed. The chromatogram for source B has been scaled so that the major peak approximates the magnitude of the same peak for source A. Peak labels correspond to the data in Table 2.

