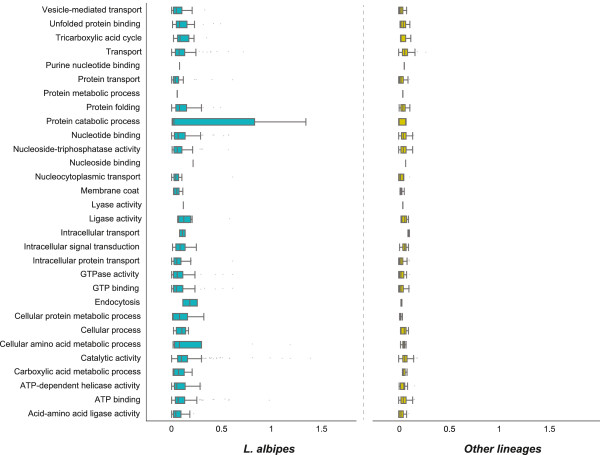
Figure 5.

Accelerated evolution in L. albipes. Gene ontology categories with a significant over-representation of genes showing signatures of accelerated evolution on the L. albipes branch (FDR <0.05) are specified on the y-axis. ω (dN/dS) values are on the x-axis with the scale ranging from ω =0 to ω =2. Blue boxplots indicate the range of ω for the genes associated with each GO term on the L. albipes branch. The yellow boxplots indicate the range of ω values for these genes in the remaining branches.
