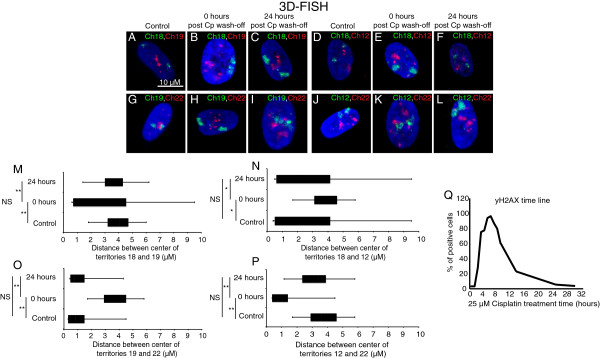
Figure 8.

Relocated chromosomes revert to distributions similar to control cells post cisplatin wash-off. 3D-FISH analyses were performed to compute the pairwise distance distribution between relocating CTs 19 and 12 vis-à-vis static CTs 18 and 22 (A-L). The pairwise distance distributions between CTs 19 and 18 (A, B, C and M), 19 and 22 (G, H, I and O), 12 and 18 (D, E, F and N), and 12 and 22 (J-L and P) for at least 50 nuclei were measured. The box plots (M, N, O, P) span the second quartile, median and the fourth quartile of the pairwise distances, while negative and positive error bars represent the minimum and maximum distances. * indicates P = 0.01. (Q) Quantitation of γH2AX positive cells at various time points post cisplatin treatment.
