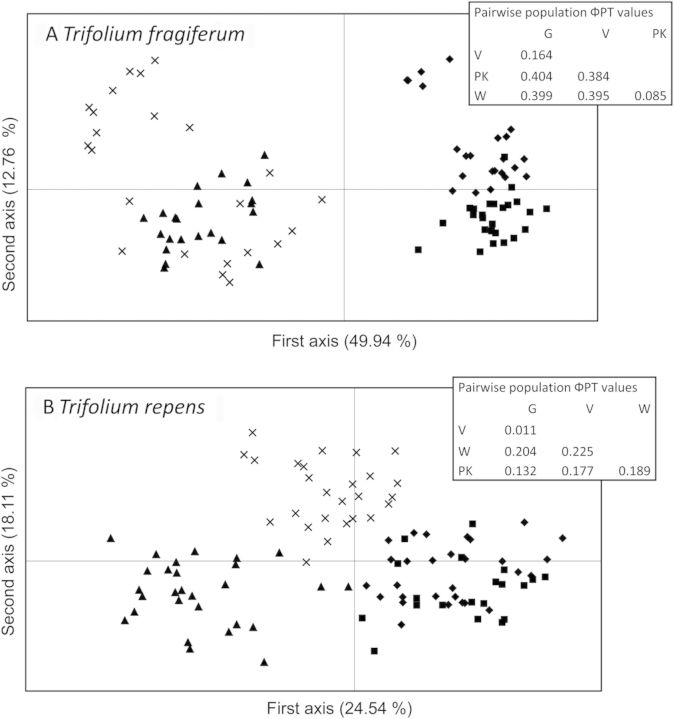
Figure 1.
Principal coordinates analysis and ΦPT values computed from AMOVA on individuals of T. fragiferum (A) and T. repens (B) populations. Principal coordinates analysis plots and ΦPT values are based on 63 AFLP markers for T. fragiferum and on 47 AFLP markers for T. repens. The symbols represent riverine (filled uptriangle, Pannerdensche Kop, PK; cross, Waardenburg, W) and coastal dune slack (filled square, Oost-Voorne, V; filled diamond, Goedereede, G) populations. Percentages of total variance explained by each axis are noted in brackets. The inlaid box shows the ΦPT values for the pairwise population comparisons. Higher ΦPT values indicate a higher degree of differentiation between populations.

