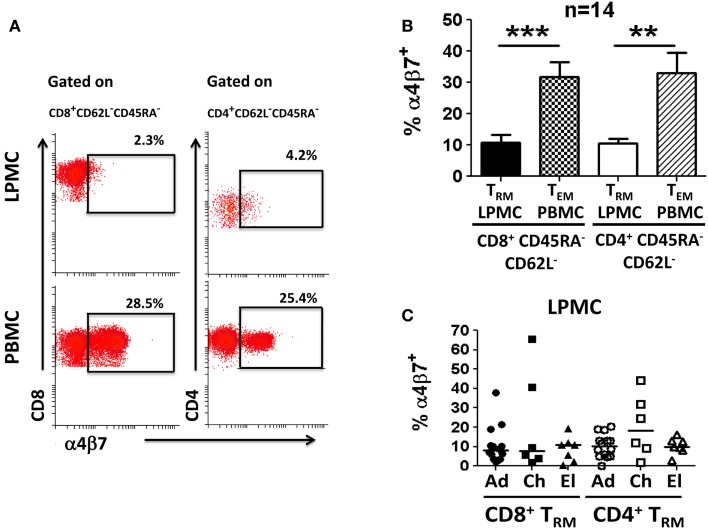
Figure 4.
Characterization of integrin α4β7 expression on memory T (TRM and TEM) cells in gastric LPMC and PBMC. (A) Representative scatter plots showing integrin α4β7 expression on CD8+ and CD4+ gastric LPMC and PBMC (data shown are from a 12-year-old child). (B) Cumulative data (n = 14) showing the percentage of CD8+ and CD4+ TRM (LPMC) as well as CD8+ and CD4+ TEM (PBMC) cells expressing integrin α4β7. Significant differences are denoted as follows: **p < 0.005; ***p < 0.0005. (C) Cumulative data comparing the percentage of CD8+ or CD4+ TRM subsets (LPMC) expressing integrin α4β7 by age group. Closed and open symbols represent CD8+ and CD4+ TRM cells, respectively: adults (Ad); children (Ch); elderly (El).

