
Figure 1.
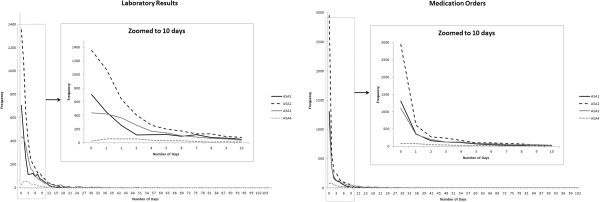
Marginal distributions for laboratory results and medication orders. Each curve shows the number of patients (y-axis) as a function of the number of days (x-axis) with Laboratory Results (left panel) or Medication Orders (right panel) for a given ASA Class. The insets provide a closer look at the curves in the range of 0 to 10 days.