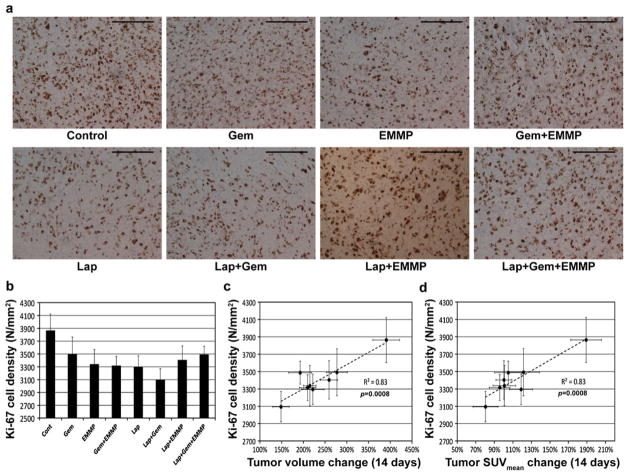
Fig. 4.
Histological analyses of tumor responses. a Representative microphotographs of tumor tissues following various therapies (Gem: gemcitabine; EMMP: anti-EMMPRIN antibody; Lap: β-lapachone), showing Ki-67 expressing cells (dark brown). The length of each scale bar is 0.1 mm. b Ki-67 cell densities of tumor tissues from groups 2–9. c, d Correlations between Ki-67 cell densities and c tumor volume changes or d tumor SUVmean changes for 14 days after therapy initiation.

