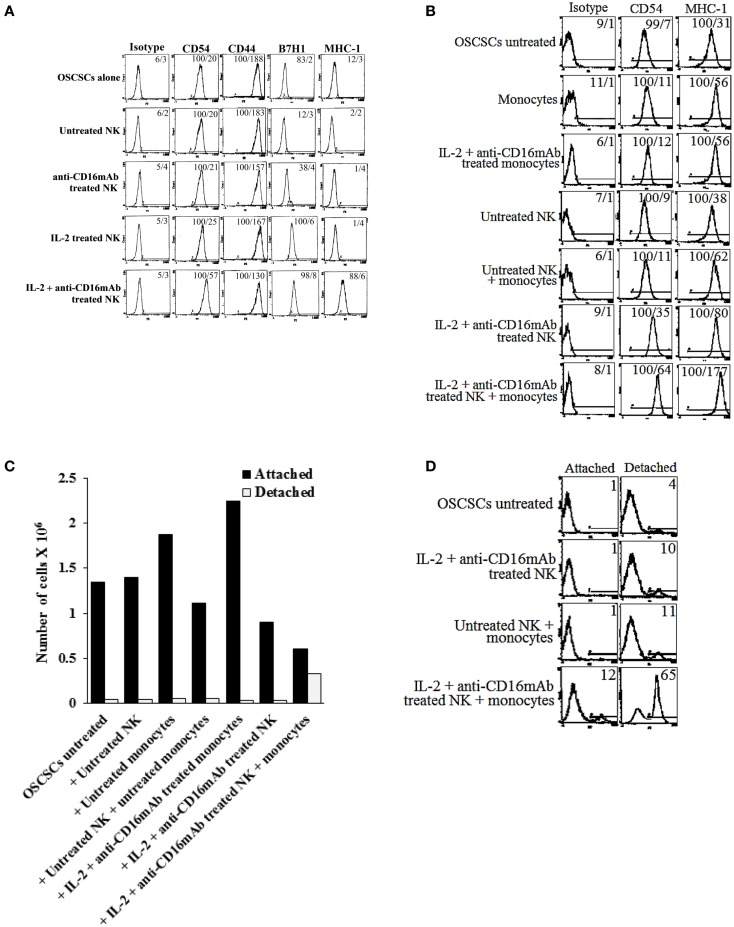
Figure 4.
Induction of resistance to NK cell-mediated cytotoxicity and inhibition of growth in OSCSCs correlated with the increased expression of CD54, B7H1, MHC class I, and decreased expression of CD44 on OSCSCs treated with supernatants from IL-2 + anti-CD16 mAb-treated NK cells with and without monocytes. NK cells were purified from healthy donors and left untreated or treated with IL-2 (1000 units/ml), anti-CD16 mAb (3 μg/ml), or the combination of IL-2 (1000 units/ml) and anti-CD16 mAb (3 μg/ml) for 24 h. Thereafter, the same amounts of supernatants from different treatments of NK cells were removed and added to OSCSCs for 5 days. OSCSCs were then washed, and the expression of CD54, CD44, B7H1, and MHC class I were assessed after staining with the PE-conjugated antibodies using flow cytometry (A). NK cells were purified from healthy donors and left untreated or treated with IL-2 (1000 units/ml), anti-CD16 mAb (3 μg/ml), or the combination of IL-2 (1000 units/ml) and anti-CD16 mAb (3 μg/ml) in the presence or absence of autologous monocytes (1:1 ratio of NK:monocytes) for 24 h. Thereafter, the same amounts of supernatants from different treatments of NK cells were removed and added to OSCSCs. After 5 days of incubation with the NK cell supernatants, OSCSCs were washed with 1× PBS, and the expression of CD54 and MHC-1 were assessed after staining with the PE-conjugated antibodies using flow cytometry (B). Isotype control antibodies were used as controls. The numbers on the right hand corner are the percentages and the mean channel fluorescence intensities for each histogram. At the end of the incubation of OSCSCs with NK cell supernatants, OSCSCs which were remained attached to the plate and those which detached during the incubation period were collected separately, and the number of cells (C) and their viability (D) were assessed using microscopy and propidium iodide staining followed by flow cytometric analysis, respectively. One of minimum three representative experiments is shown in each of (A–D).

