Figure 3.
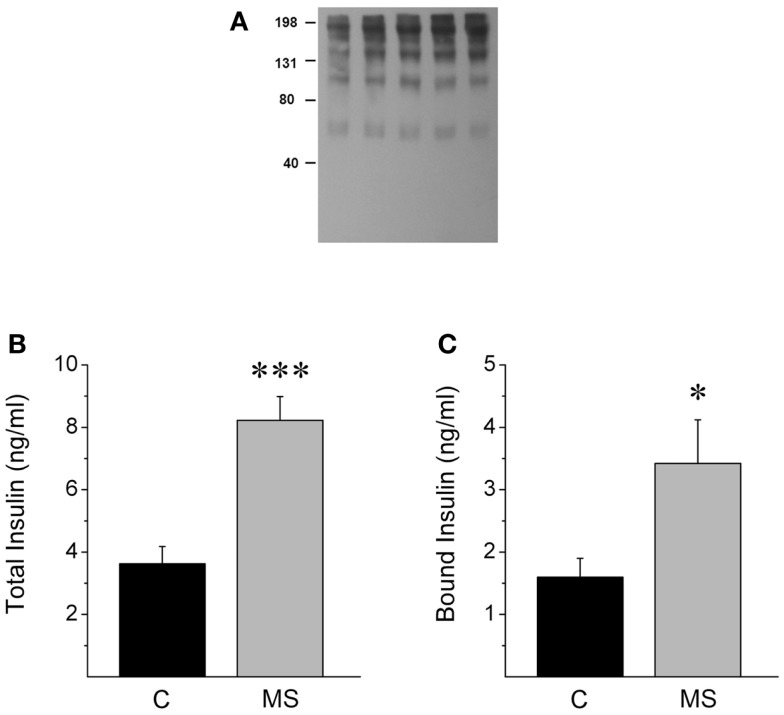
MS rats show increased insulin binding to plasmatic proteins. (A) Western blot from plasma of control rats (lane 1, 2) and MS rats (3, 4, 5) that were previously separated using different Amicon centrifugal filters and immunoprecipitated with an insulin receptor (alpha-IR) in a native gel, stained with an anti-insulin antibody. Observe that insulin is present in different molecular weight bands, Section “Materials and Methods.” (B) Rats with metabolic syndrome (MS) show increased insulin levels when compared to control rats (C). (C) MS rats display higher insulin levels in the plasmatic fraction containing proteins above 30 kDa, suggesting higher insulin binding to plasmatic proteins. Bars represent mean ± SEM of control (n = 12) and MS rats (n = 7), *p < 0.05 and ***p < 0.0001.

