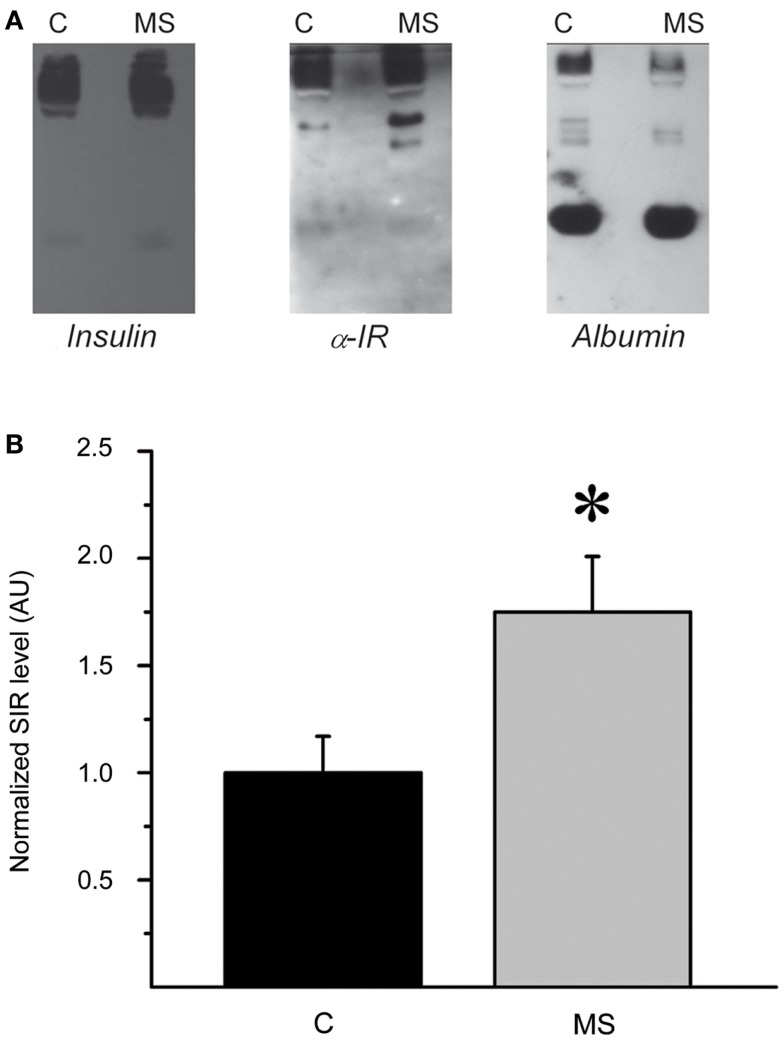
Figure 7.
Plasma SIR is increased in MS rats. (A) Western blots of native gel electrophoresis from representative plasma samples from control (C) and metabolic syndrome (MS) rats that show co-migration of insulin, SIR, and albumin in rat plasma as indicated by the colocalization of all molecules. The intensity and size of insulin and SIR bands are higher in MS rats than controls. (B) Comparison of normalized plasma SIR levels determined by densitometry of Western blot bands. Bars represent mean ± SEM of control (C) and MS rats, *p < 0.05 and **p < 0.01.

